Configure Grafana (visualization / dashboard)
You will learn basic Grafana configuration and how to build dashboards.
Configuration
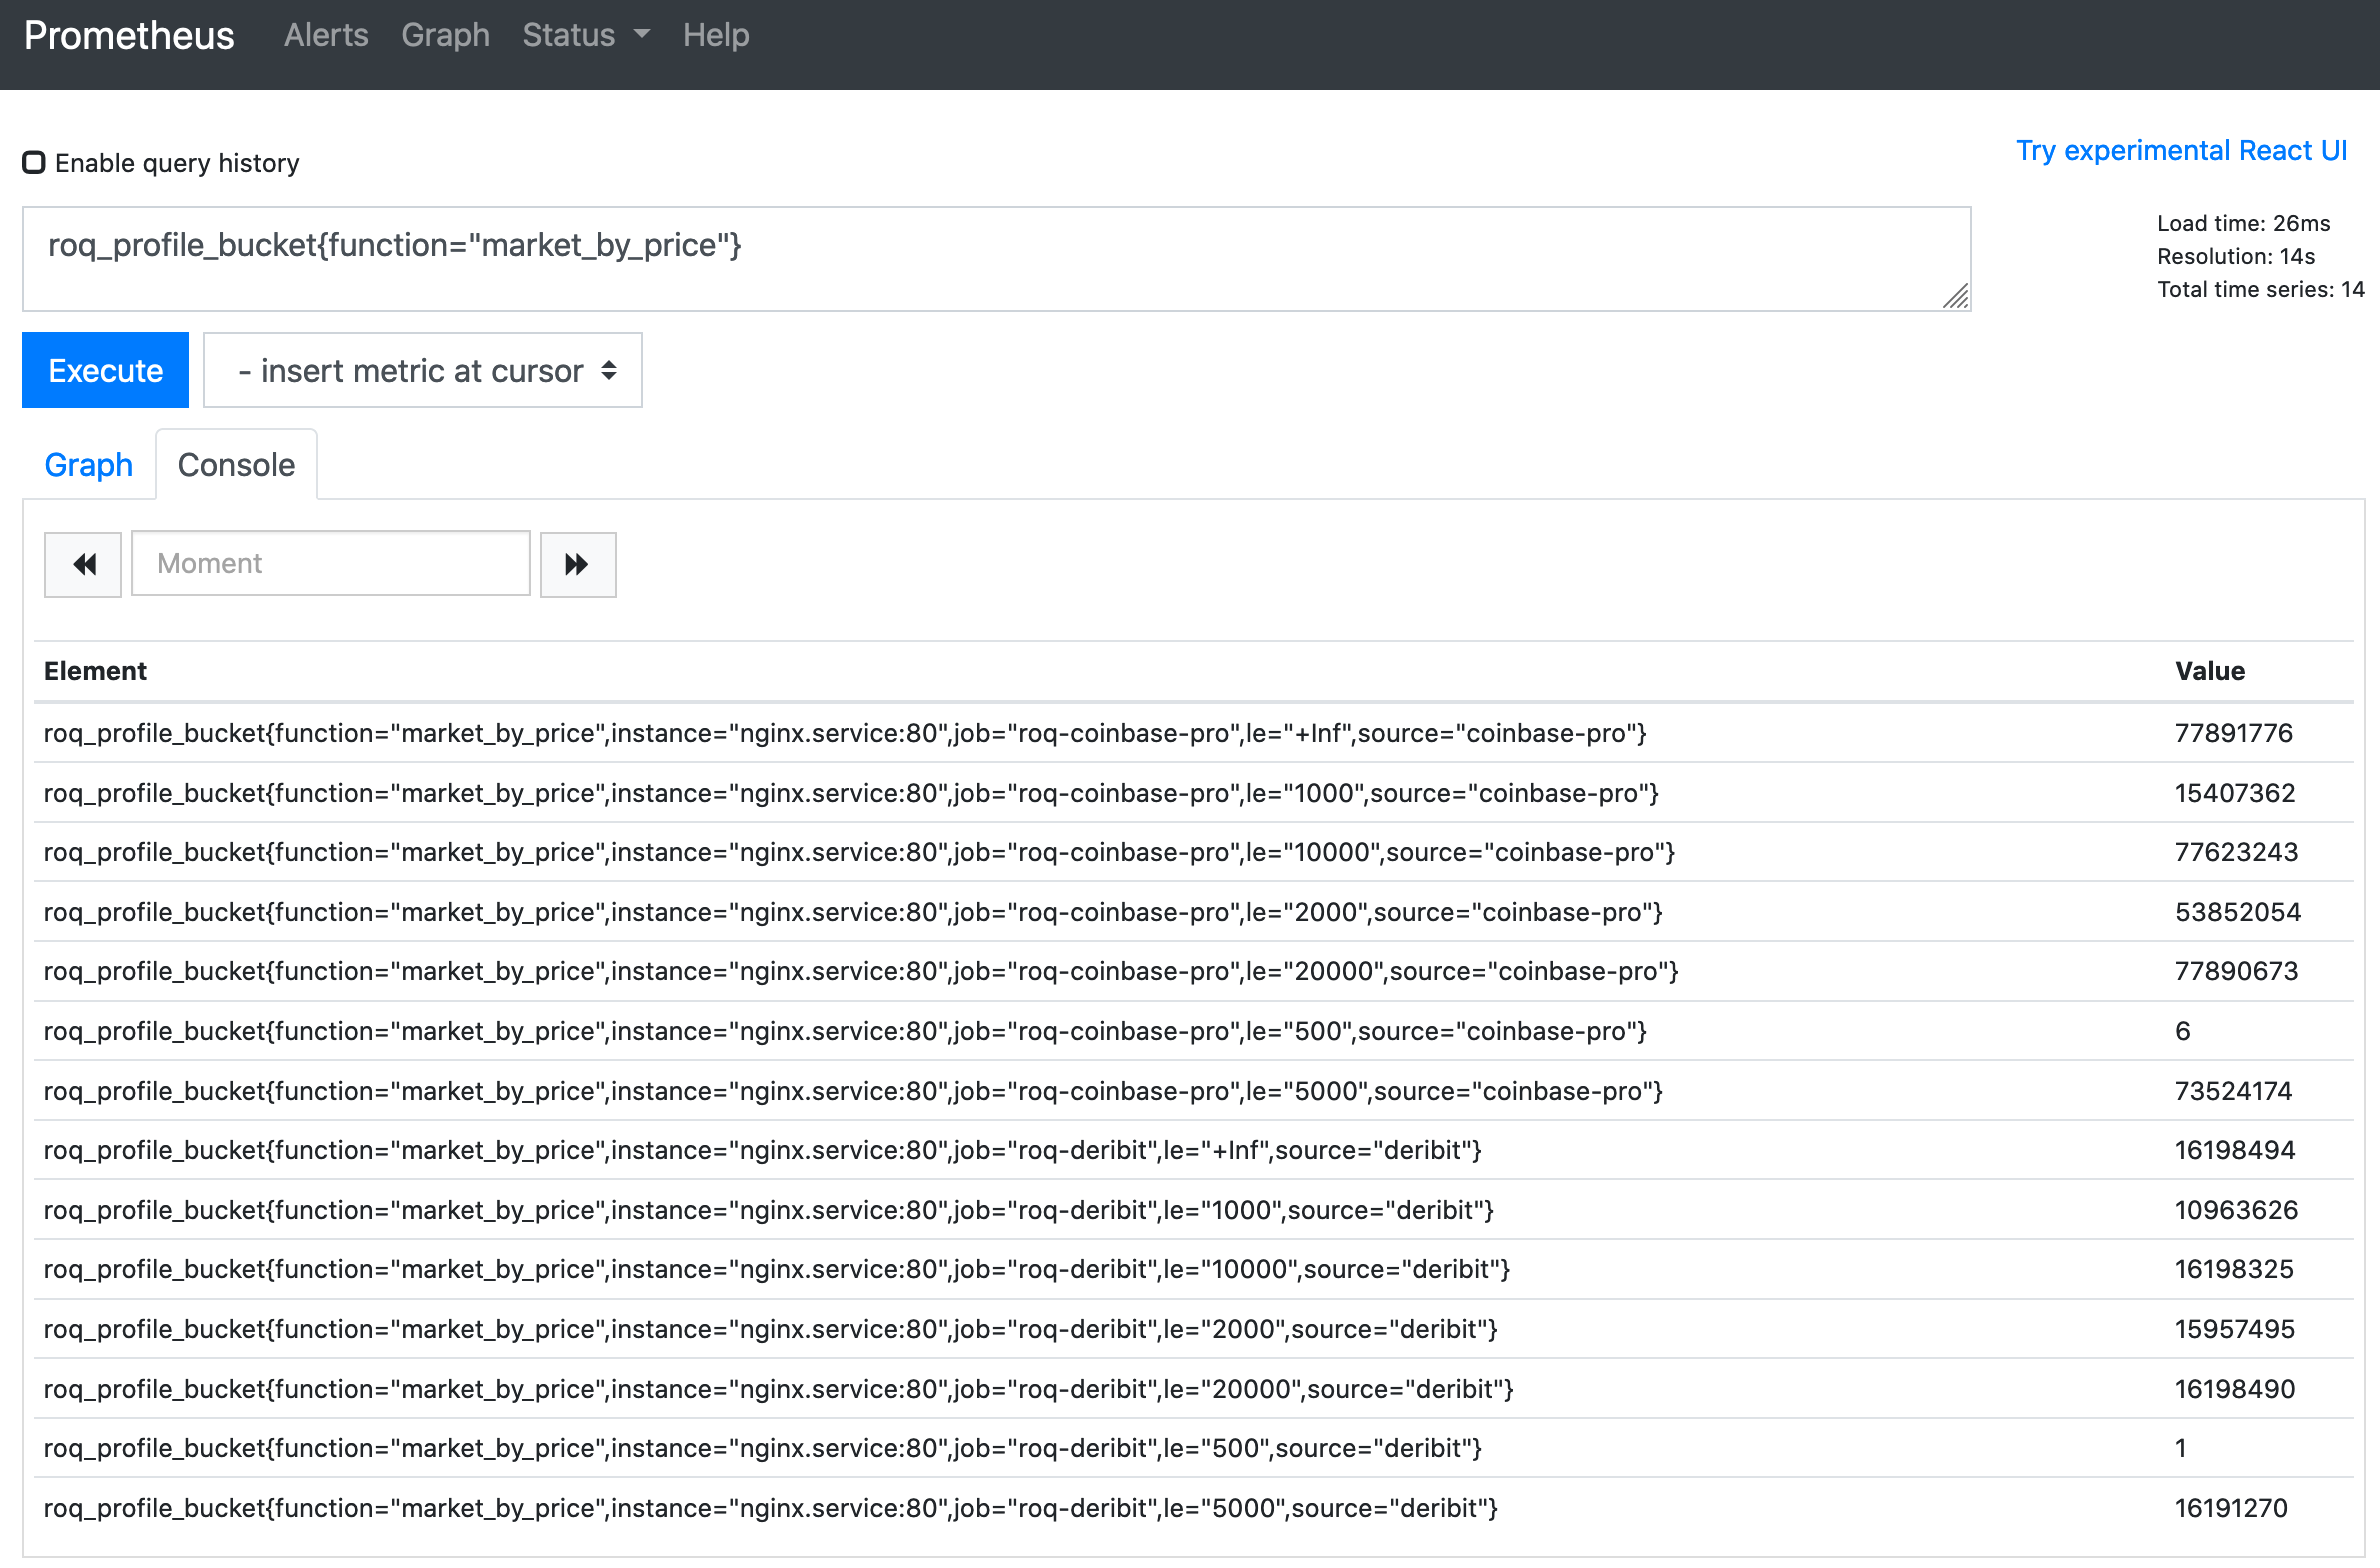
In previous blogs we demonstrated how to configure Prometheus and gateways so we could capture the history of various metrics.
Grafana must be configured to connect to Prometheus.
Navigate to “Connections” > “Data sources”, then click the “Add new data source” button
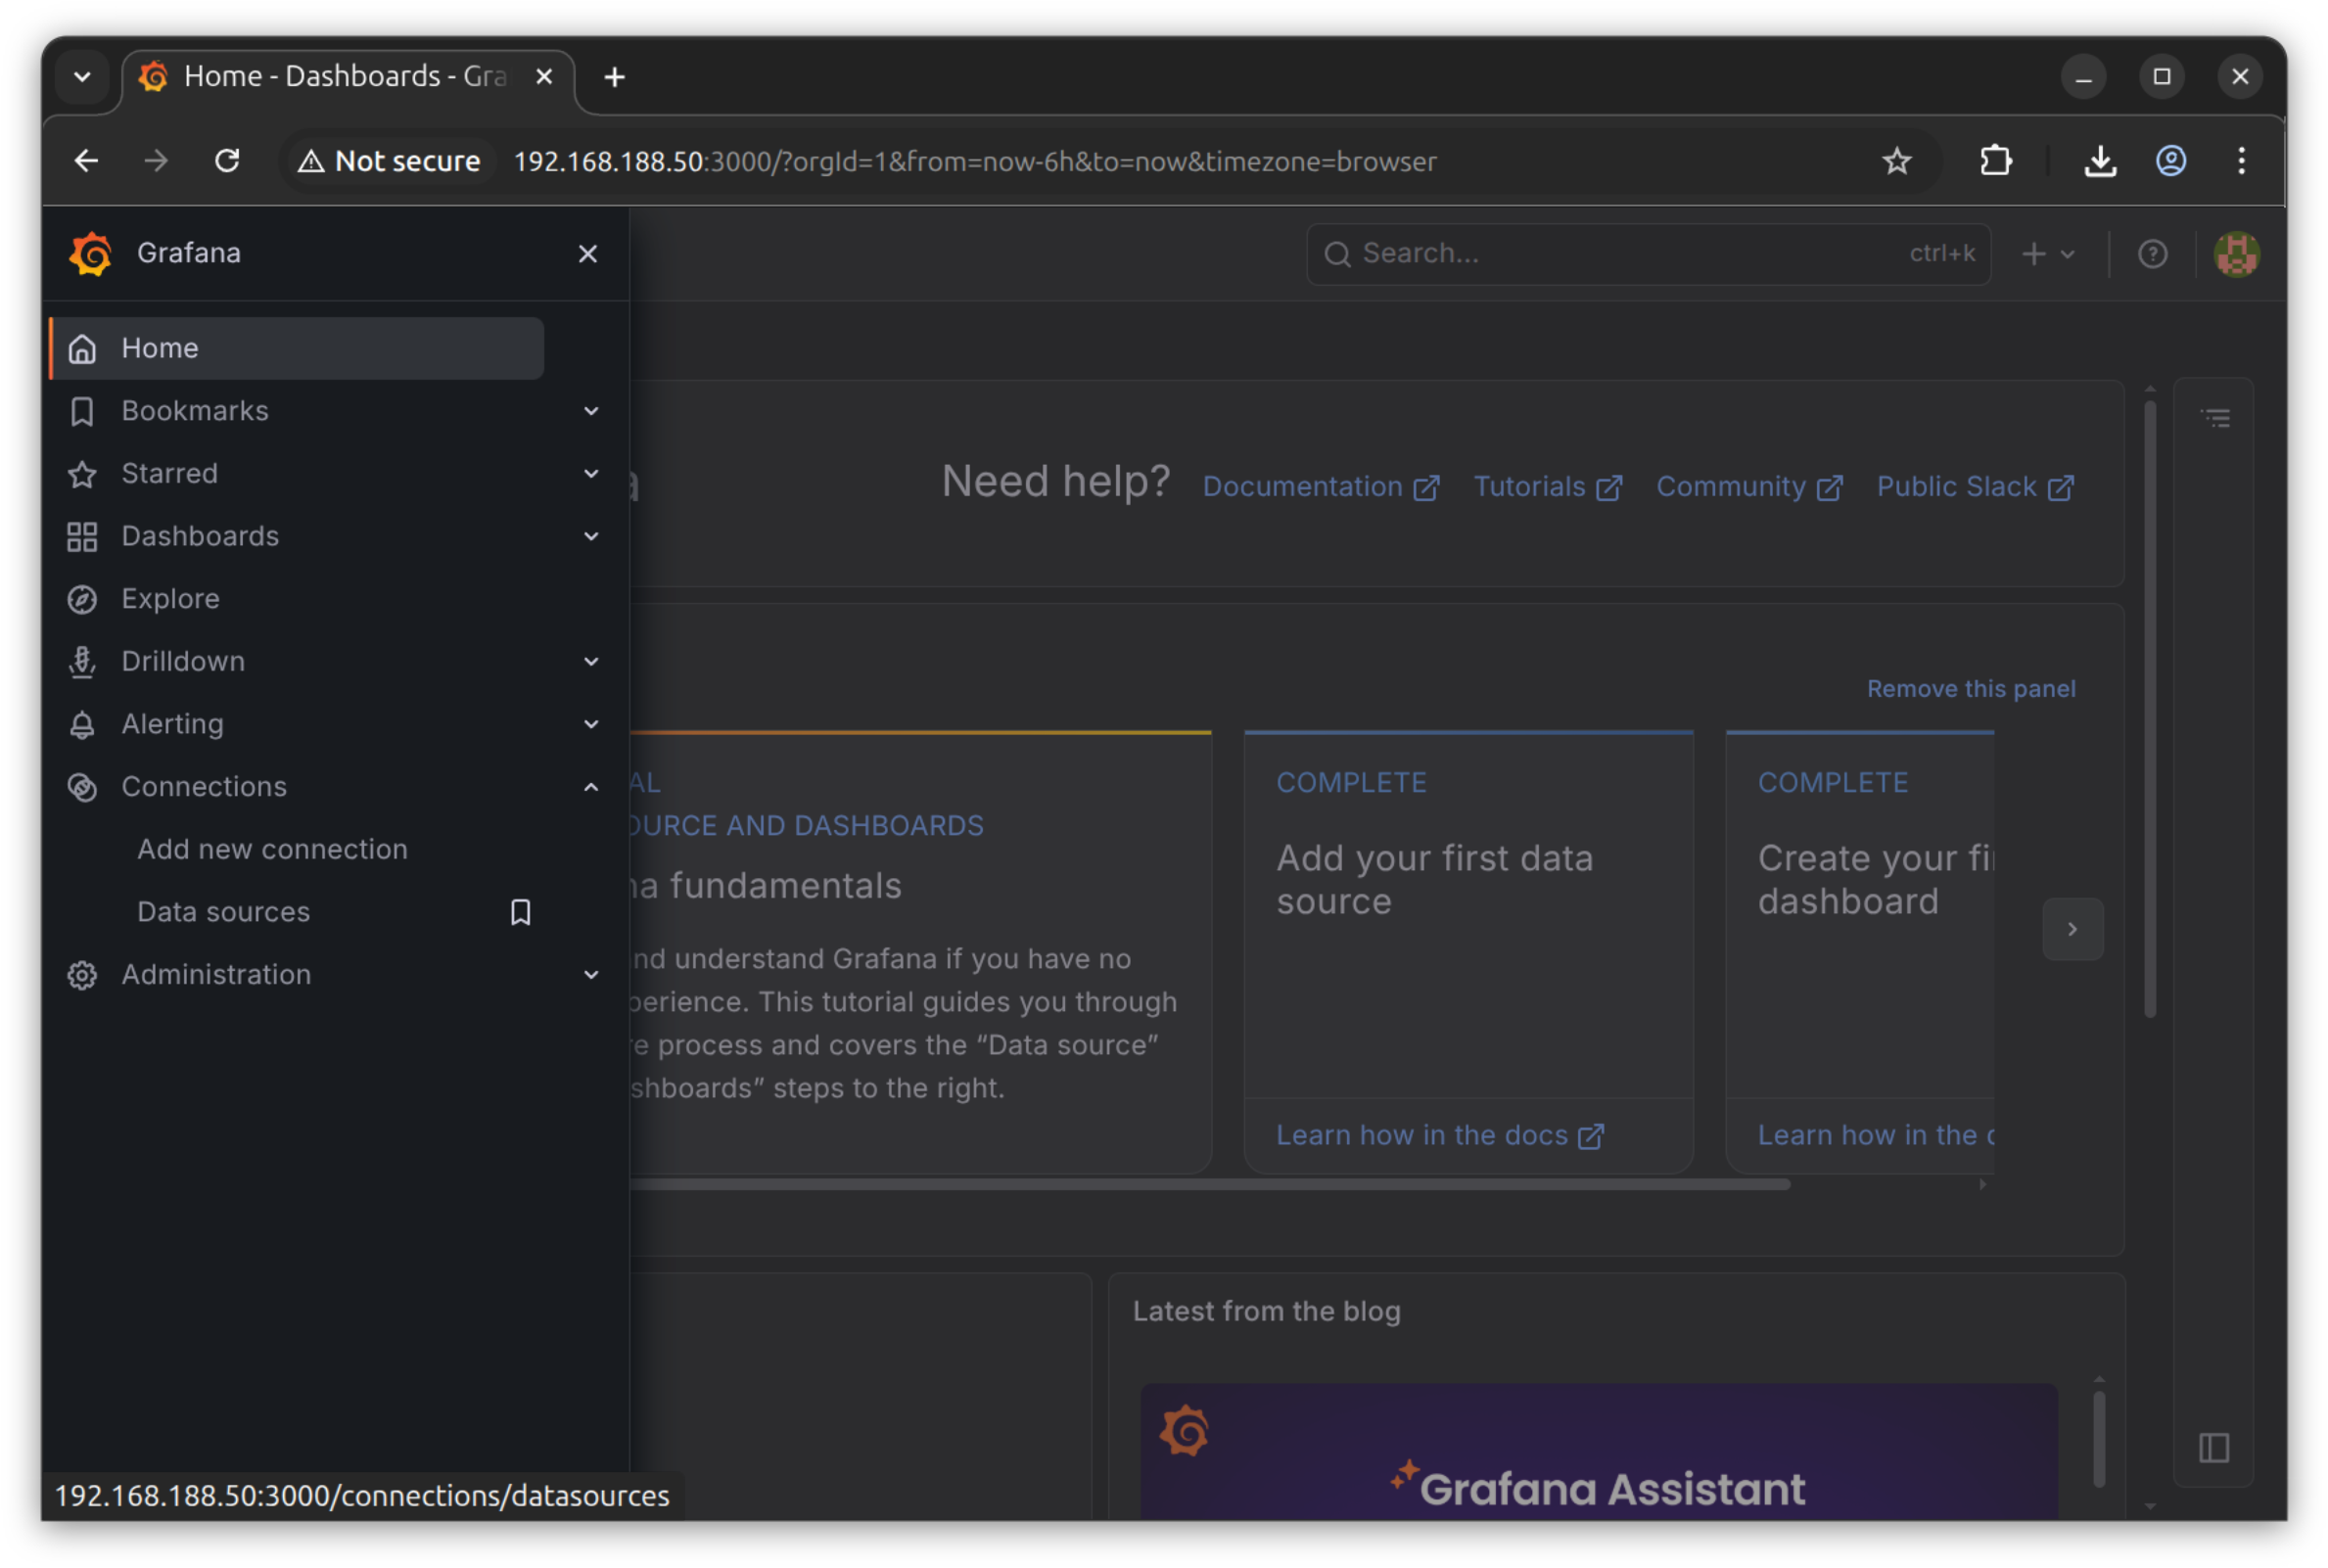
We have to add a Prometheus source with an appropriate URL
Note
The “Save and test” button ensures that the connection to Prometheus can indeed be established.
Introduction
Navigate to “Dashboards” and click the “New” button followed by “New dashboard”
Now hit the “+” button to add a new panel
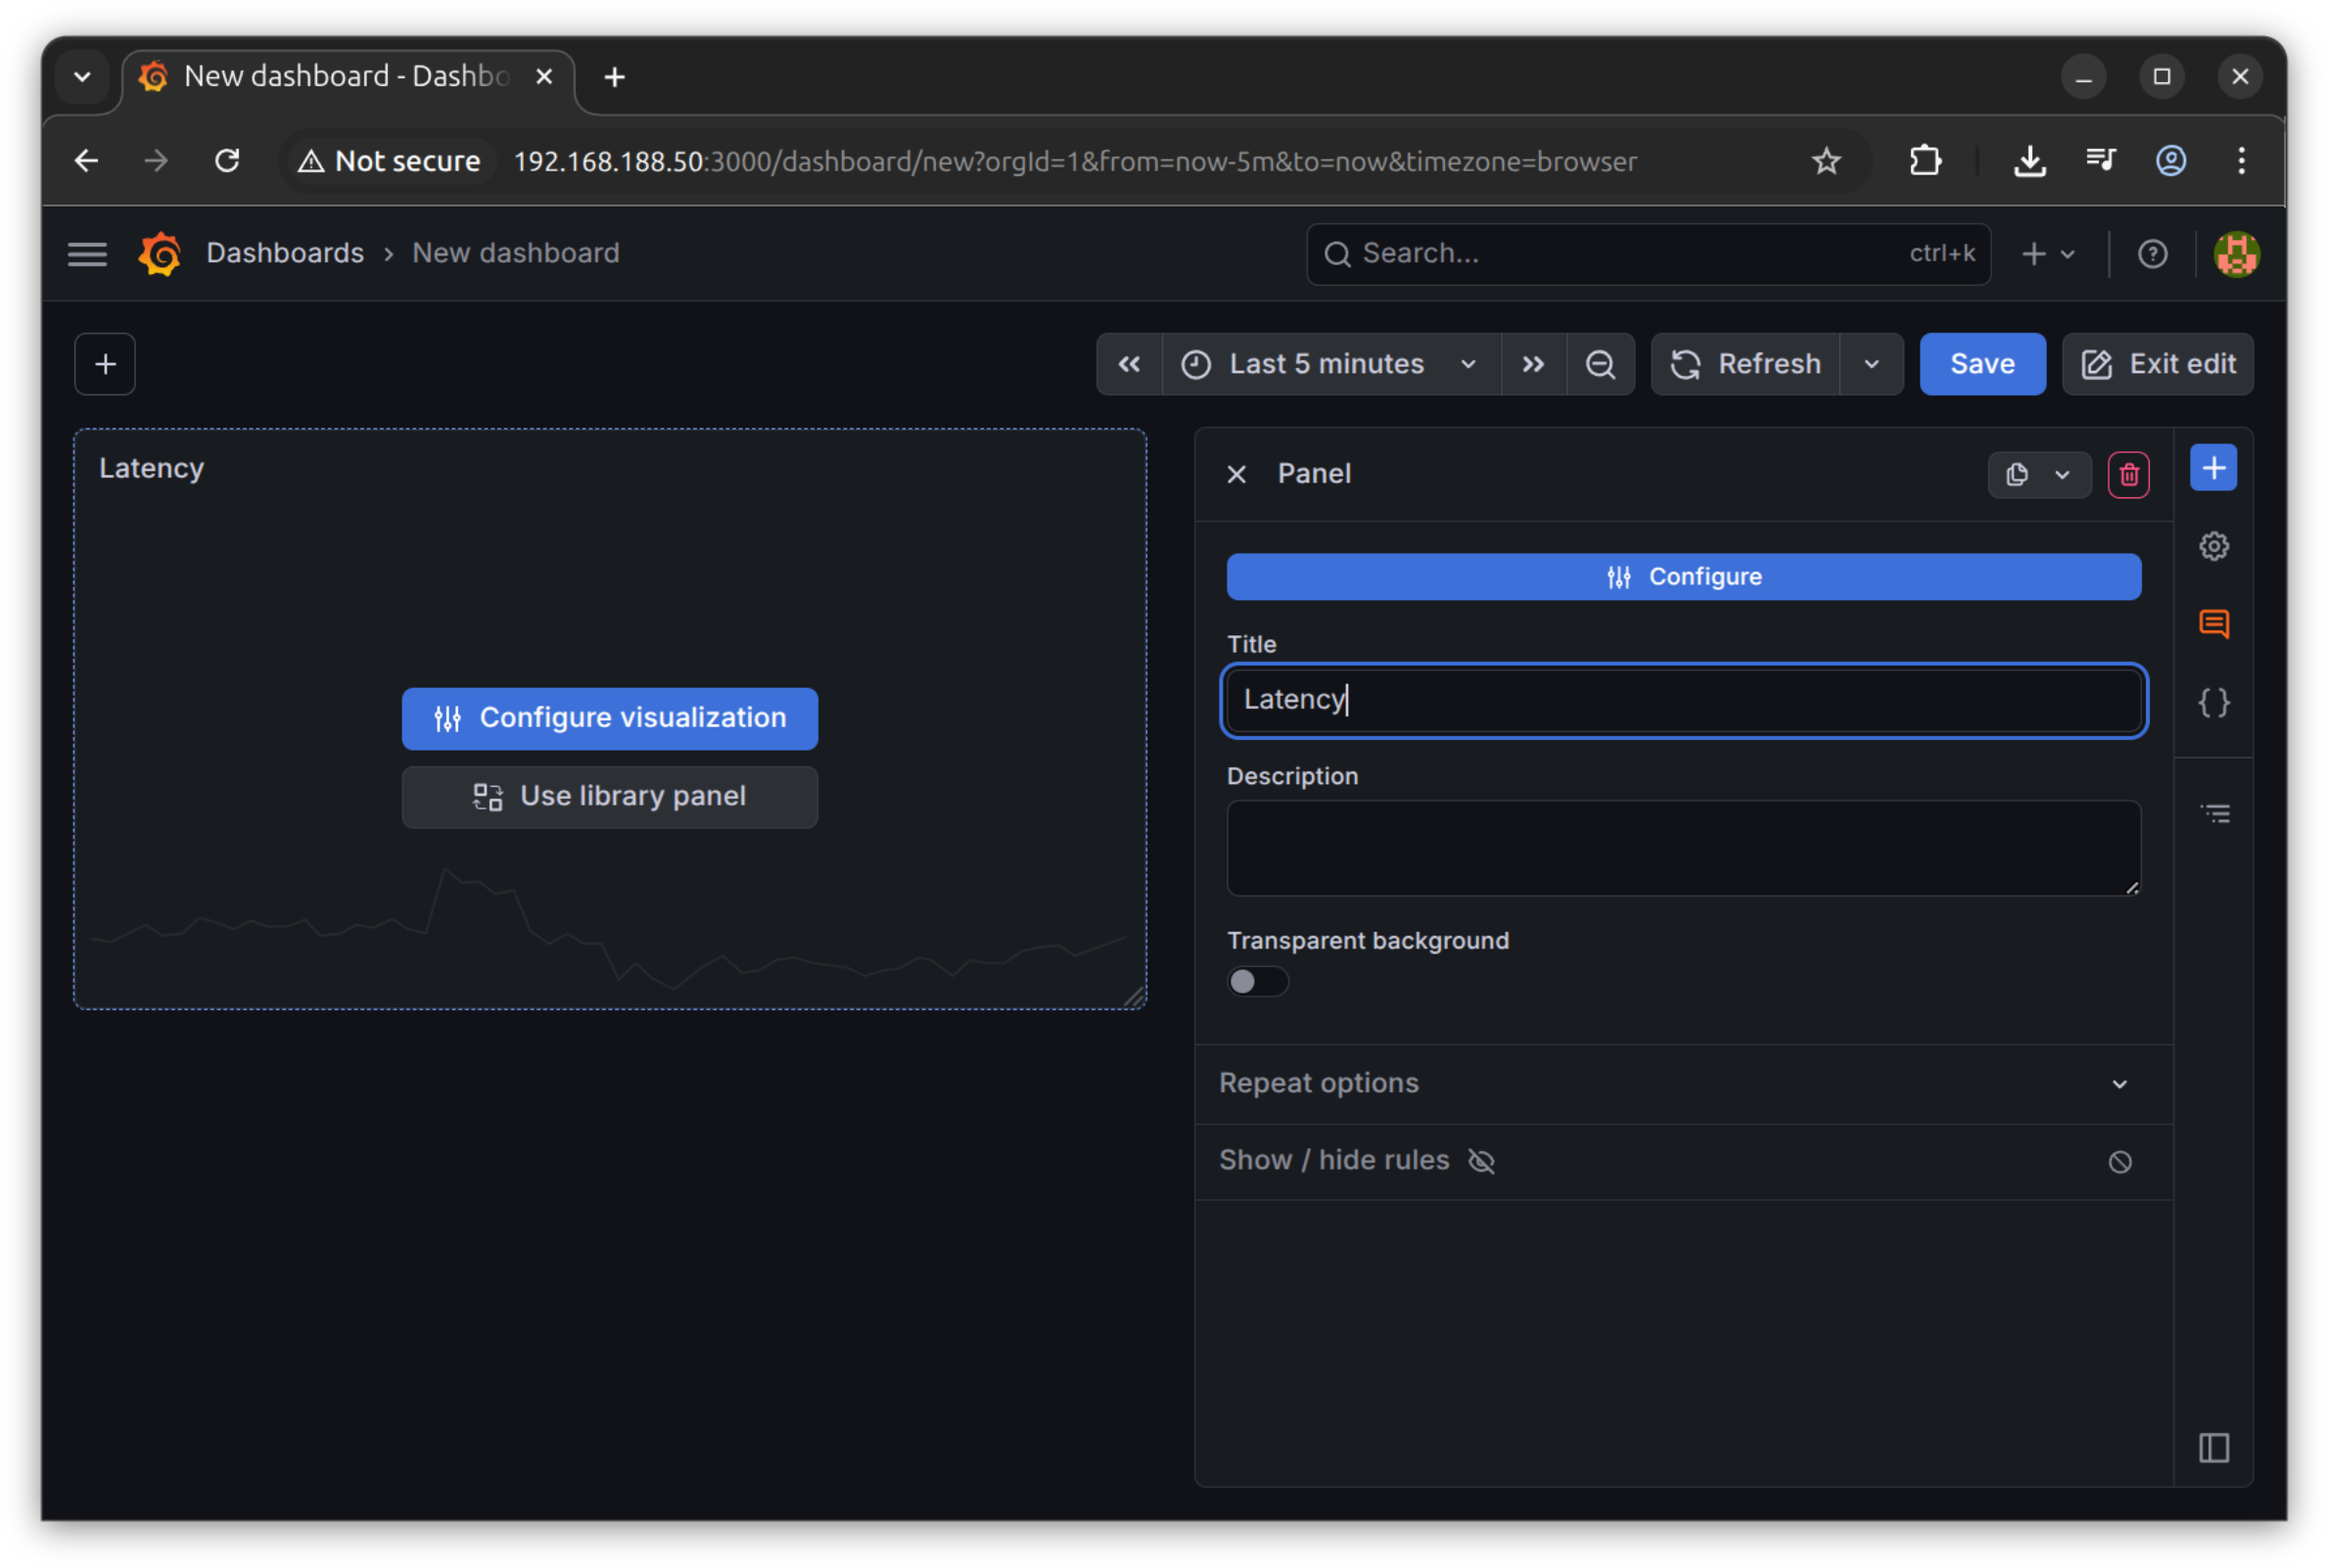
Now choose the “Configure visualization” button
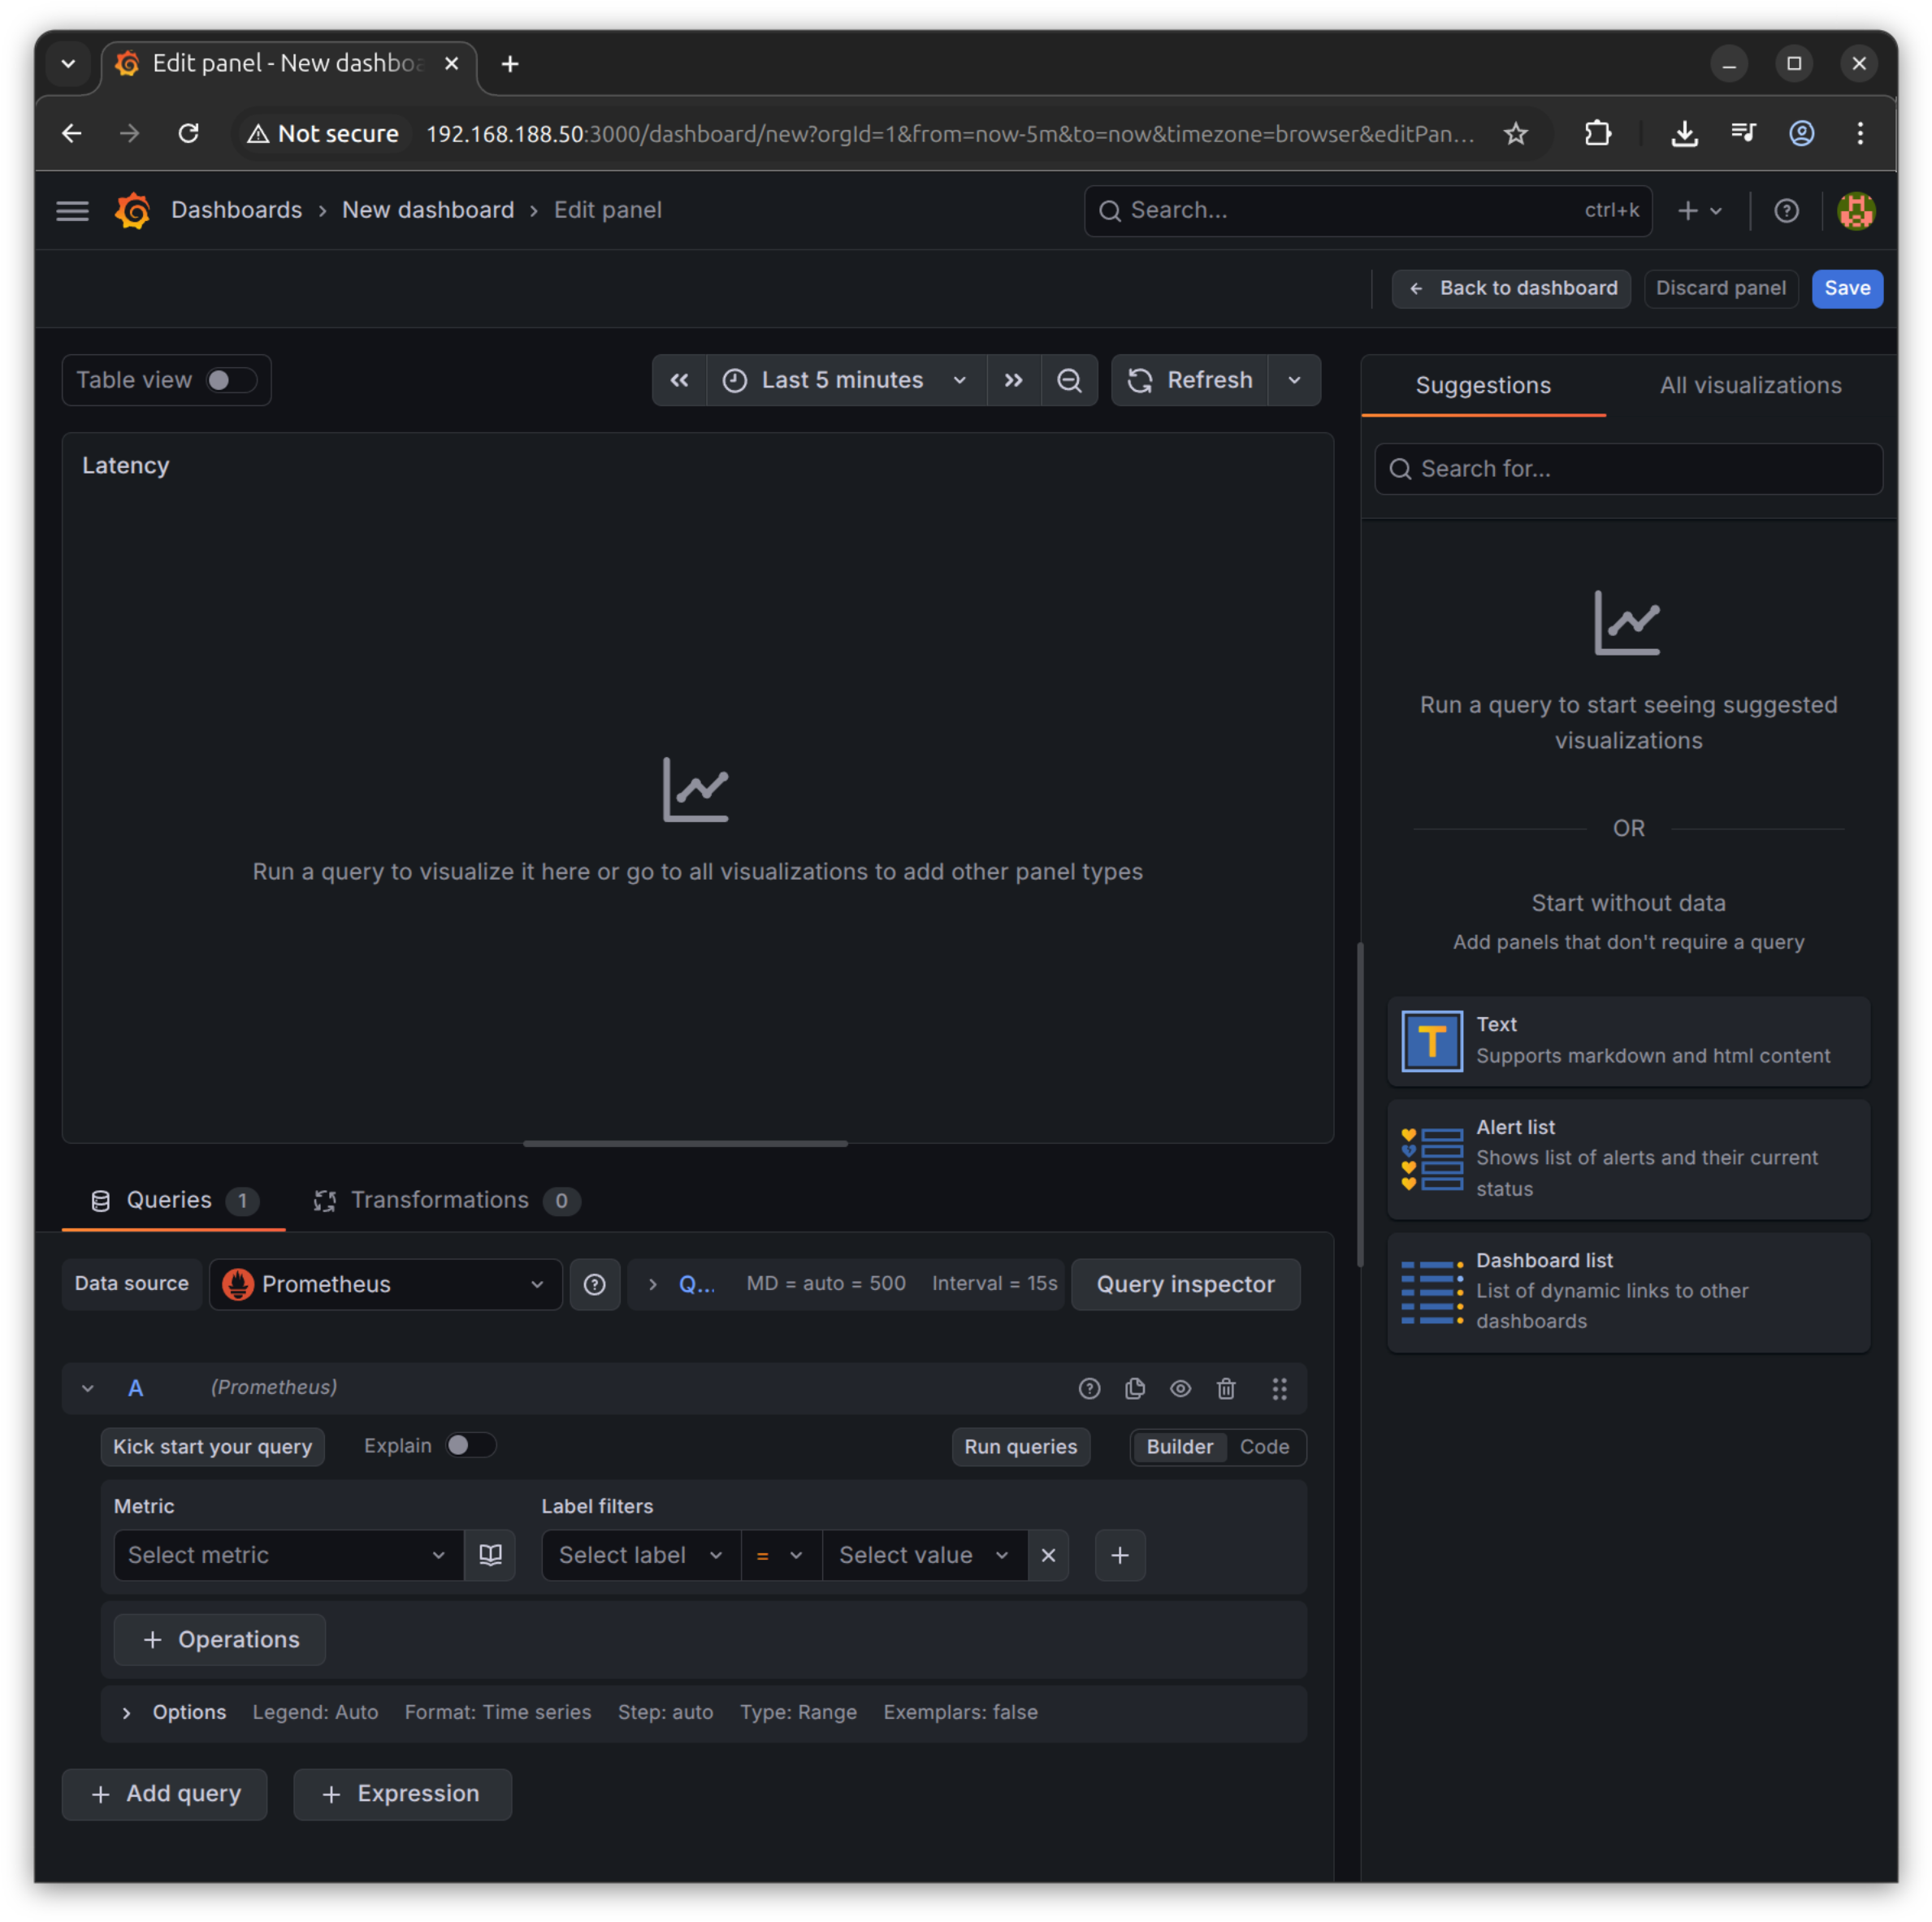
Grafana selects the Prometheus data source and it has a powerful expression builder.
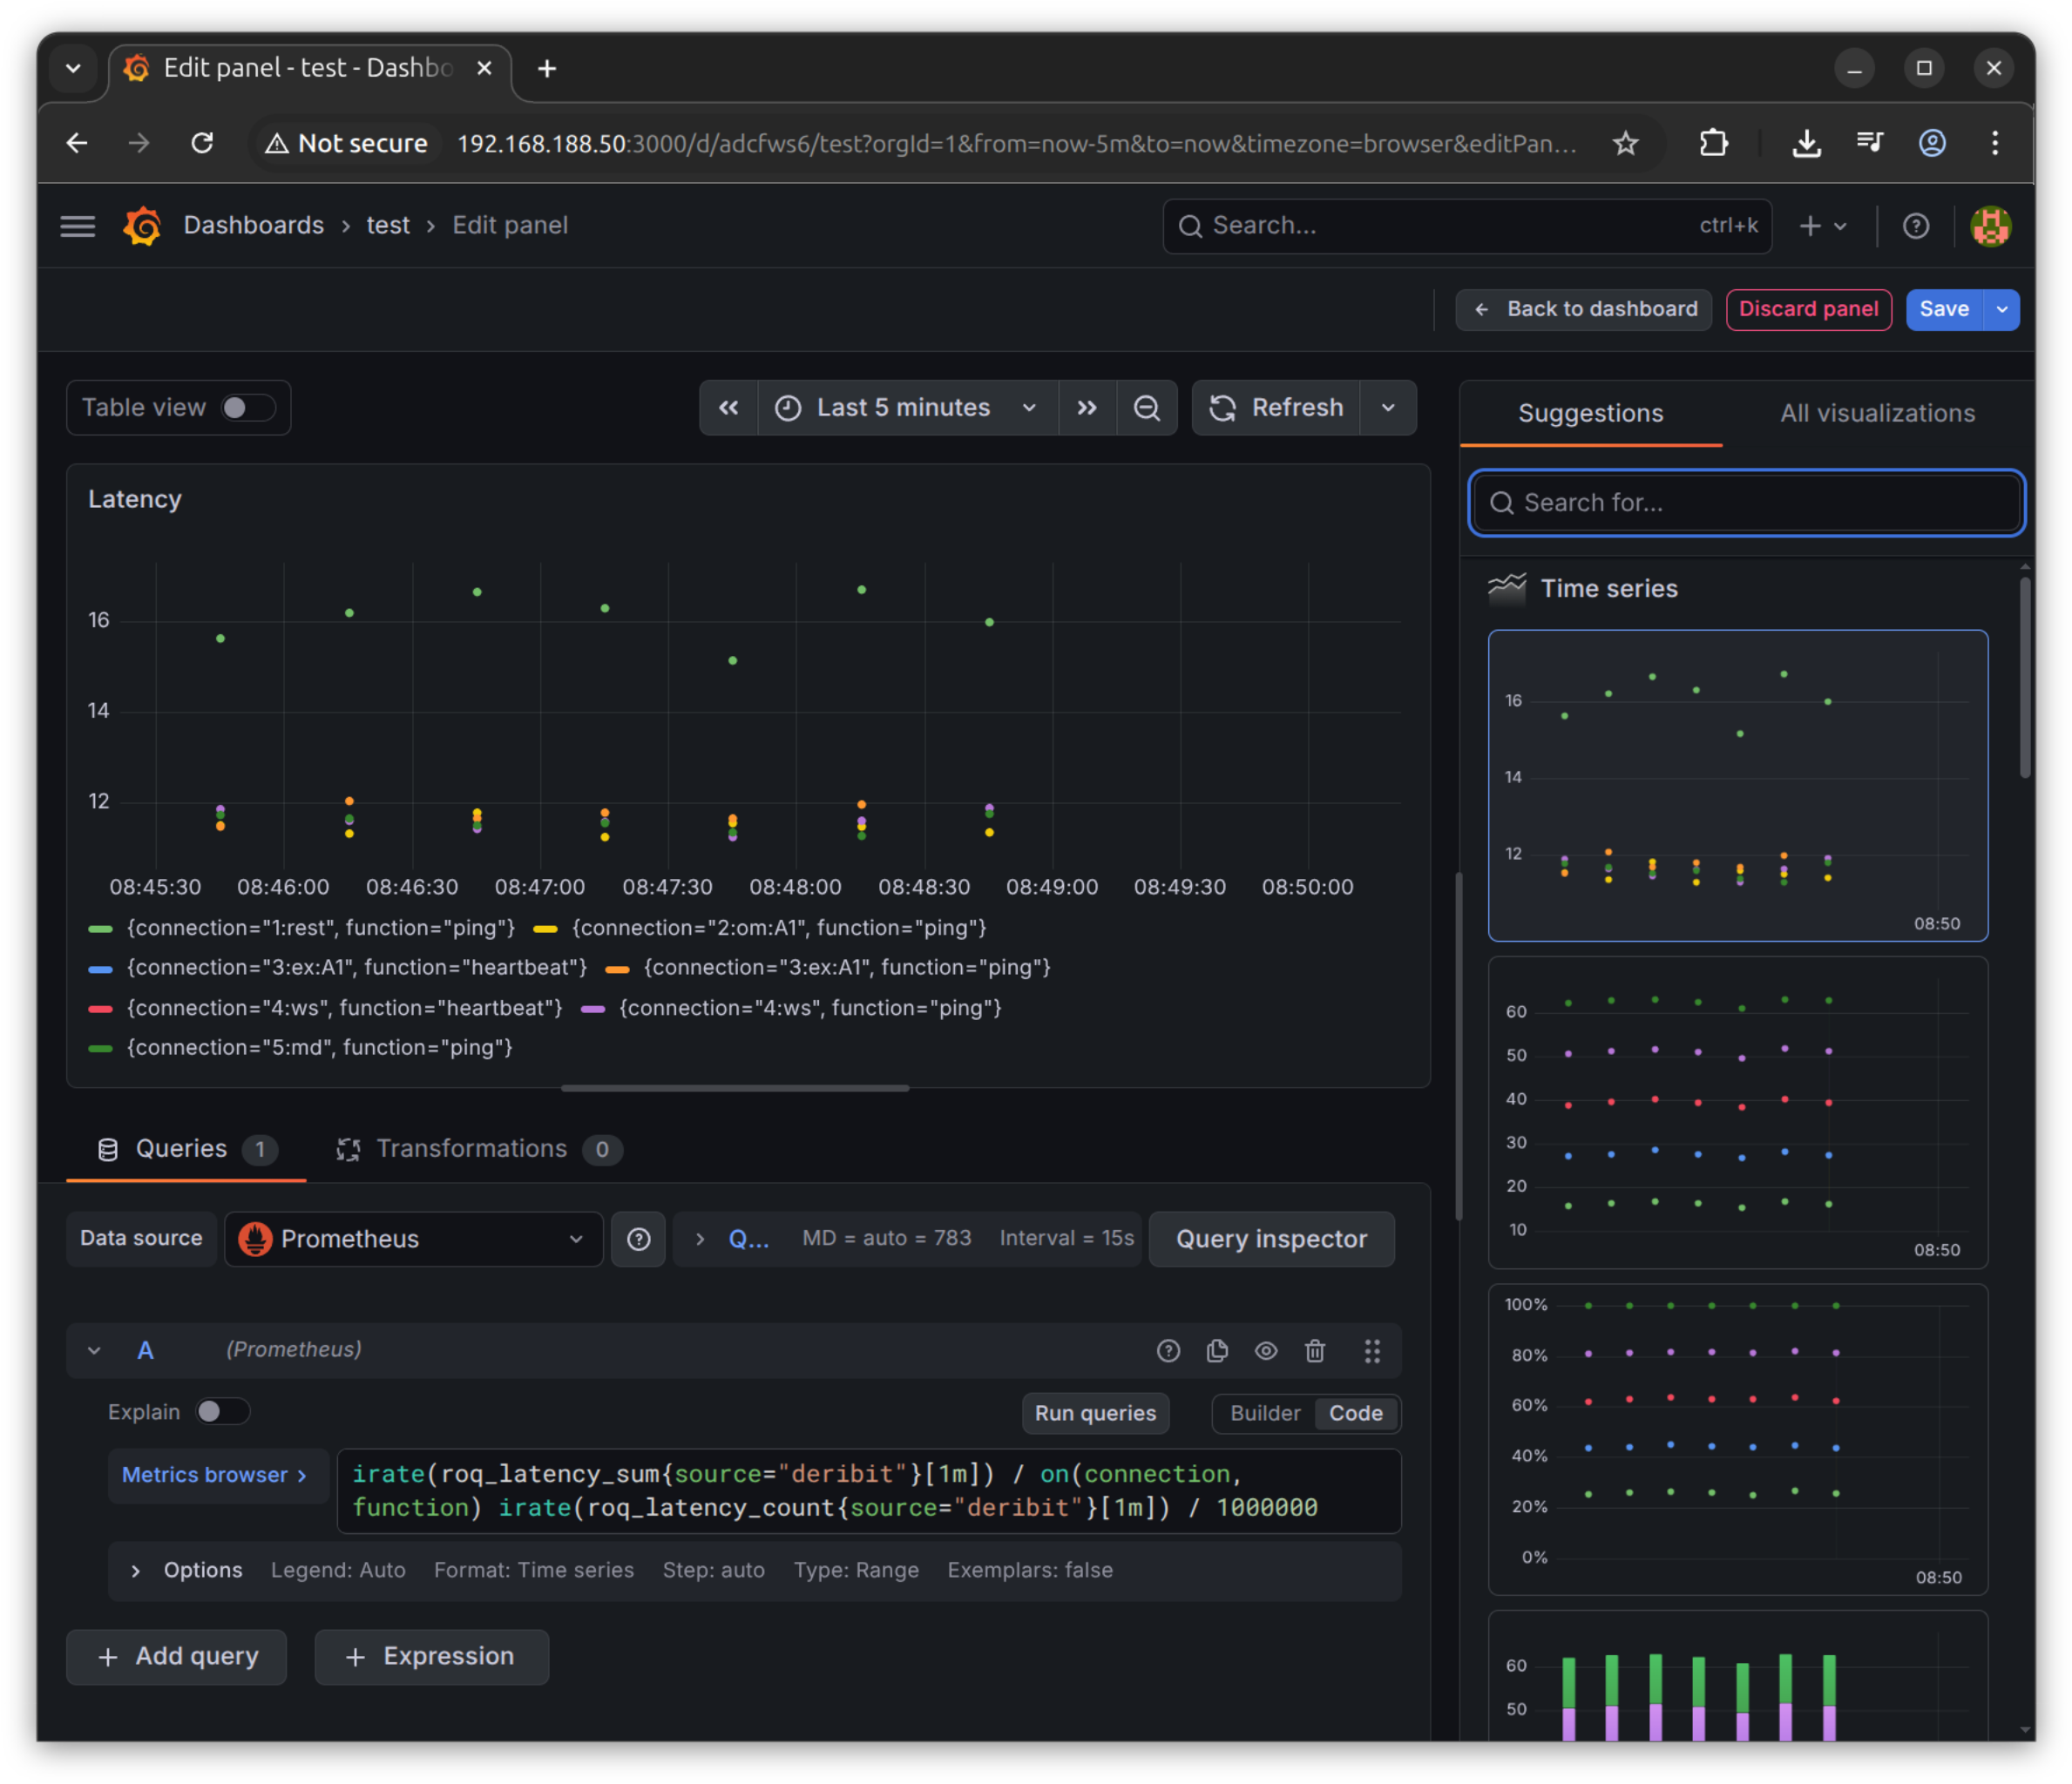
Change to “Code” (from “Builder”) and copy the PromQL expressions from the Prometheus blog.
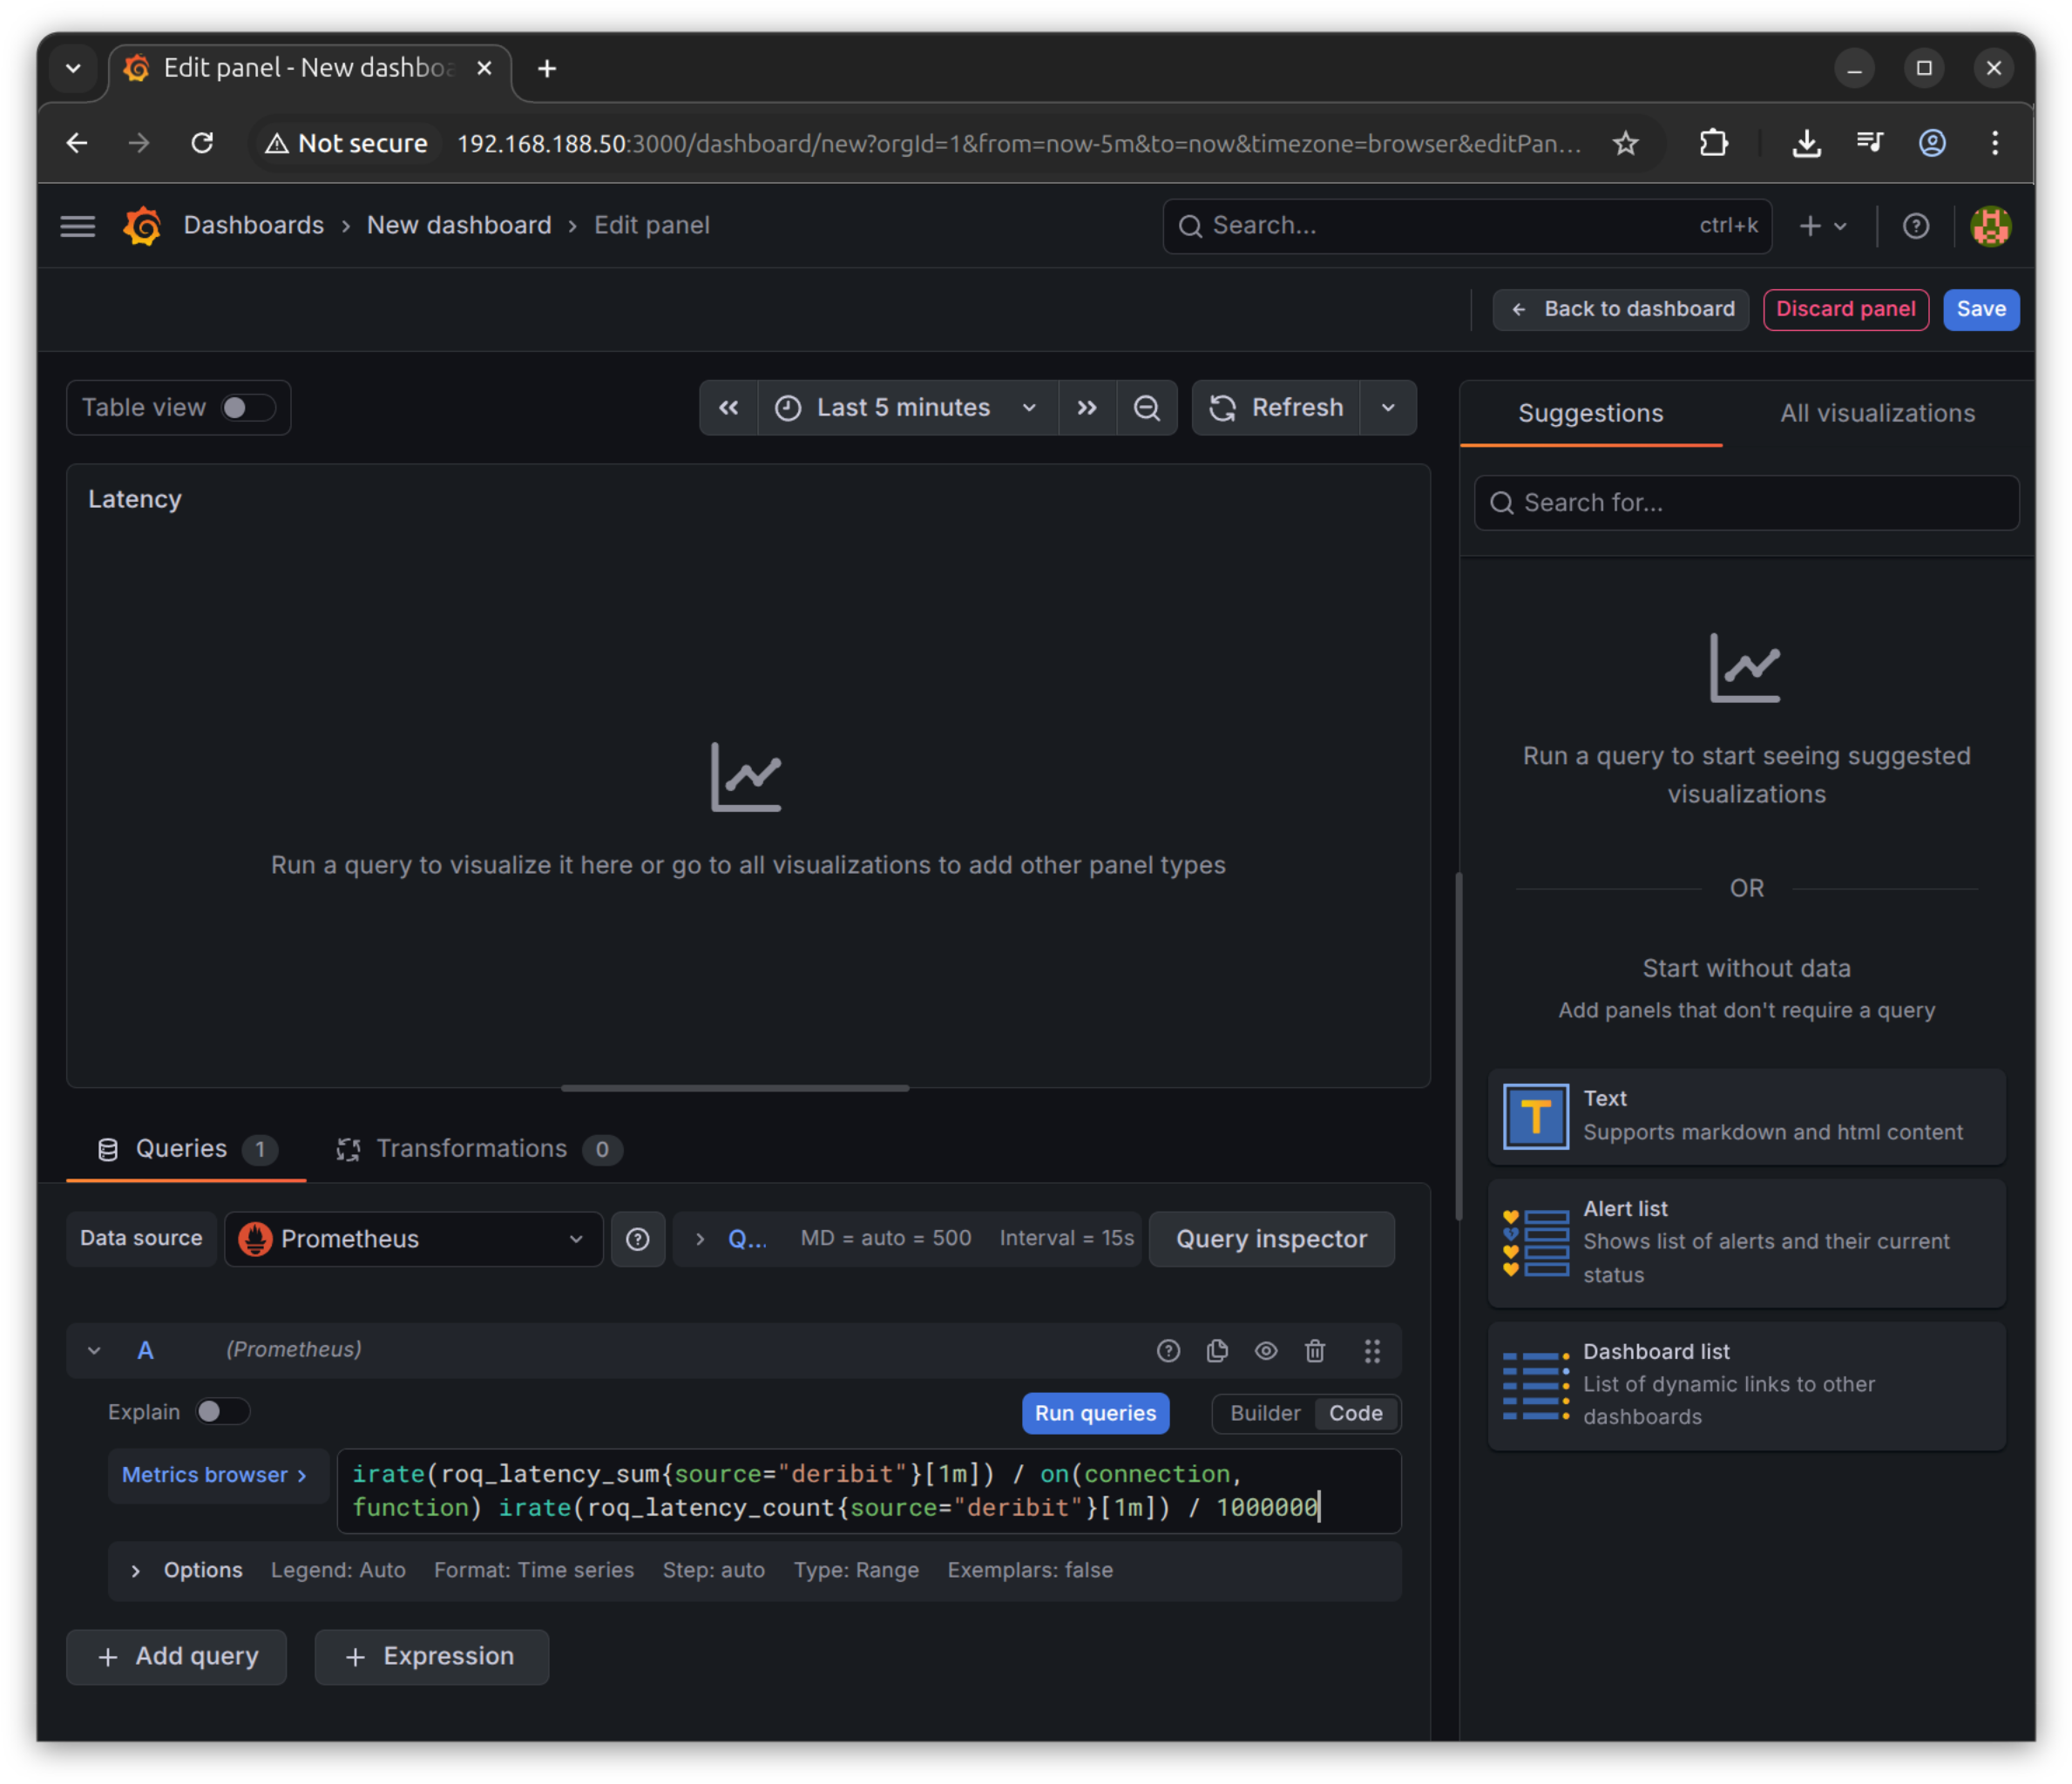
Save to see the result
Dashboard
Roq has an Ansible script to install Grafana, including configuring Prometheus and installing a get-started dashboard.
You can find the dashboard here
This is an example using the Deribit gateway
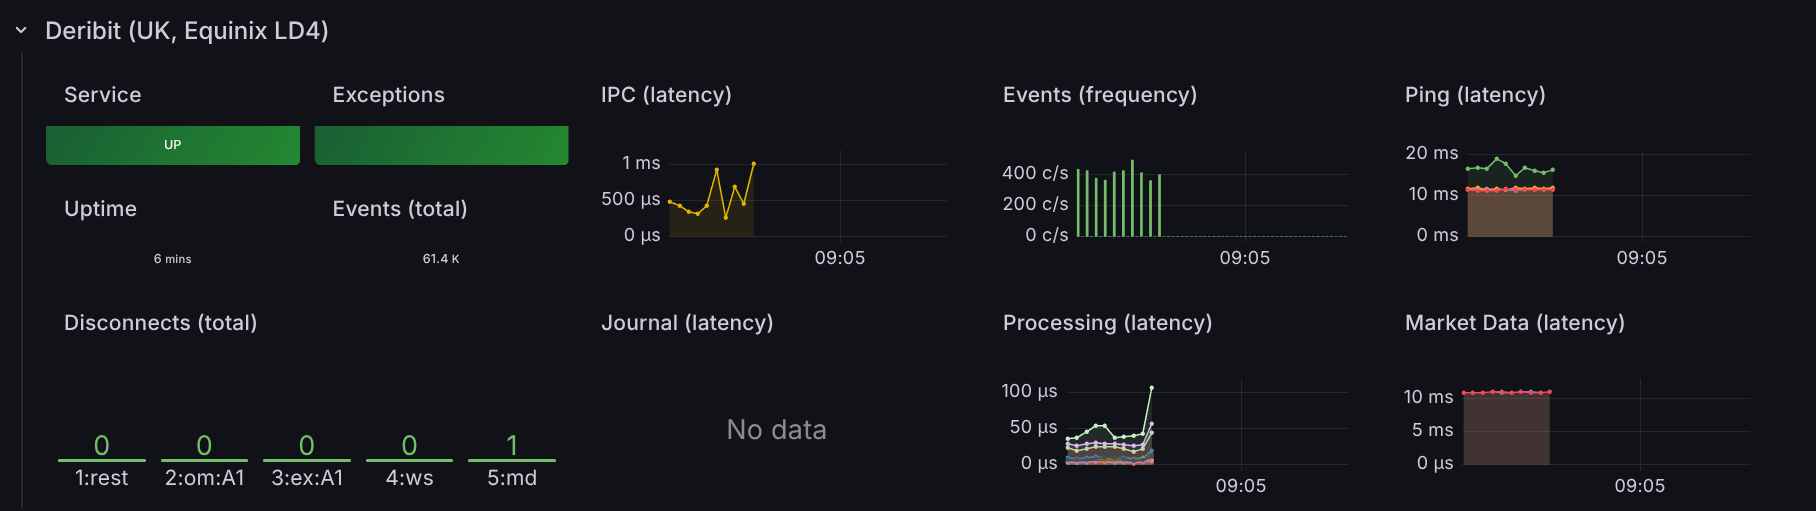
Note
The latency measurements are not great because this example was captured from a general purpose development server.