Gateways
We will use the Deribit gateway for the following examples.
Note
All gateways use a core set of flags and similar template for the config file. Differences normally relate to authentication and how to define the end-points needed to communicate with the exchange.
Installing
$ conda create --name test
$ conda activate test
$ conda install -y --channel https://roq-trading.com/conda/stable \
    roq-deribit
Configuring
You can start by making a copy of the template config file
$ cp --config_file $CONDA_PREFIX/share/roq-deribit/config.toml ~/deribit.toml
You should edit the copy: look for these lines and replace as appropriate
login = "YOUR_DERIBIT_LOGIN_GOES_HERE"
secret = "YOUR_DERIBIT_SECRET_GOES_HERE"
The login and secret must be created using the Deribit web interface
Using
$ roq-deribit \
    --name "deribit" \
    --config_file ~/deribit.toml \
    --client_listen_address ~/deribit.sock
This will launch the gateway using the config file you just created.
The gateway will be listening for client connections using the UNIX domain
socket openend on ~/deribit.sock.
The name flag is required and e.g. used to identify the gateway when a
client connects to it.
Event Logs
All events are automatically persisted to your filesystem using the relative
path: <ISO week>/<name>/<timestamp>.roq, for example
2020-W31/deribit/1596198613995.roq.
The timestamp is the process startup time in milliseconds since epoch.
This convention avoids duplicates, allows you to easily sort based on time and is convenient for persisting files so they can easily be backed up.
Note
Event logs are not updated in real time. Default is to flush when a 1MB memory buffer is full or if 5 minutes have passed (whichever condition is met first). The primary reason for throttling output is that data is being compressed: the compressor can simply do a better job when it can processes more data in memory. These are just the defaults and the behavior be overriden by setting appropriate flags.
You can use event logs when simulating trading strategies or to feed third-party database solutions.
Authentication
Unlocking all gateway features will require a license. To validate a license, you will have to follow these steps
First generate your own public/private key pair using roq-keygen (from
the roq-tools package)
$ roq-keygen > keys.json
Warning
This file contains both the public and private keys. Keep this file SAFE and NEVER reveal the private key to anyone!
Depending on your operational setup, you may generate
a single key pair for all your instances,
a key pair per region, or
a key pair per instance.
Be mindful that the former is more efficient in terms of coordinating with Roq Support.
Important
You will have to communicate the public key to Roq Support so the key can be associated with your license agreement.
You can now start the unlocked gateway by authenticating with Roq’s license manager
$ roq-deribit \
    --name "deribit" \
    --config_file ~/deribit.toml \
    --client_listen_address ~/deribit.sock \
    --auth_keys_file $KEYS_FILE \
    --auth_cache_dir $CACHE_DIR
Note
A directory can be used for caching the acquired access tokens. This provides some resiliency to network outages.
The --auth_lock_period flag is used as a hint to the license manager for
the period you want to lock a license.
The default period is 2 hours and has been chosen to provide some resiliency to
network outages.
Note
You should reduce the lock period if you are experimenting with your gateway configuration file. A new license will be required each time you change the list of configured API keys. You may then have to wait for a previously locked license to be released.
Monitoring
Adding support for metrics
$ roq-deribit \
    --name "deribit" \
    --config_file ~/deribit.toml \
    --service_listen_address 1234 \
    --client_listen_address ~/deribit.sock
From another terminal
$ curl http://localhost:1234/metrics
Will give you very detailed information about gateway performance using Prometheus’ Exposition Format.
For example
[...]
# TYPE roq_events histogram
roq_events_bucket{source="deribit", le="500"} 689
roq_events_bucket{source="deribit", le="1000"} 7920
roq_events_bucket{source="deribit", le="2000"} 16035
roq_events_bucket{source="deribit", le="5000"} 18918
roq_events_bucket{source="deribit", le="10000"} 19207
roq_events_bucket{source="deribit", le="20000"} 20093
roq_events_bucket{source="deribit", le="+Inf"} 20711
roq_events_sum{source="deribit"} 5.69656e+07
roq_events_count{source="deribit"} 20711
[...]
This gives us some information about the distribution of processing times
processed 20711 events (_count)
689 of those was done in less than 500ns (_bucket{…, le=”500”})
7920 of those was done in less than 1000ns (_bucket{…, le=”1000”}) — this includes the 689 also counted for less than 500ns
The total time spent processing events is 5.69656e+07ns (_sum).
From this we have very useful information about the distribution of processing times.
The gateways will automatically collect such metrics and varying levels of granularity, for example
# TYPE roq_profile histogram
roq_profile_bucket{source="deribit", connection="enqueue", function="market_by_price_update", le="500"} 0
roq_profile_bucket{source="deribit", connection="enqueue", function="market_by_price_update", le="1000"} 0
roq_profile_bucket{source="deribit", connection="enqueue", function="market_by_price_update", le="2000"} 71
roq_profile_bucket{source="deribit", connection="enqueue", function="market_by_price_update", le="5000"} 1181
roq_profile_bucket{source="deribit", connection="enqueue", function="market_by_price_update", le="10000"} 4428
roq_profile_bucket{source="deribit", connection="enqueue", function="market_by_price_update", le="20000"} 5752
roq_profile_bucket{source="deribit", connection="enqueue", function="market_by_price_update", le="+Inf"} 6034
roq_profile_sum{source="deribit", connection="enqueue", function="market_by_price_update"} 5.31952e+07
roq_profile_count{source="deribit", connection="enqueue", function="market_by_price_update"} 6034
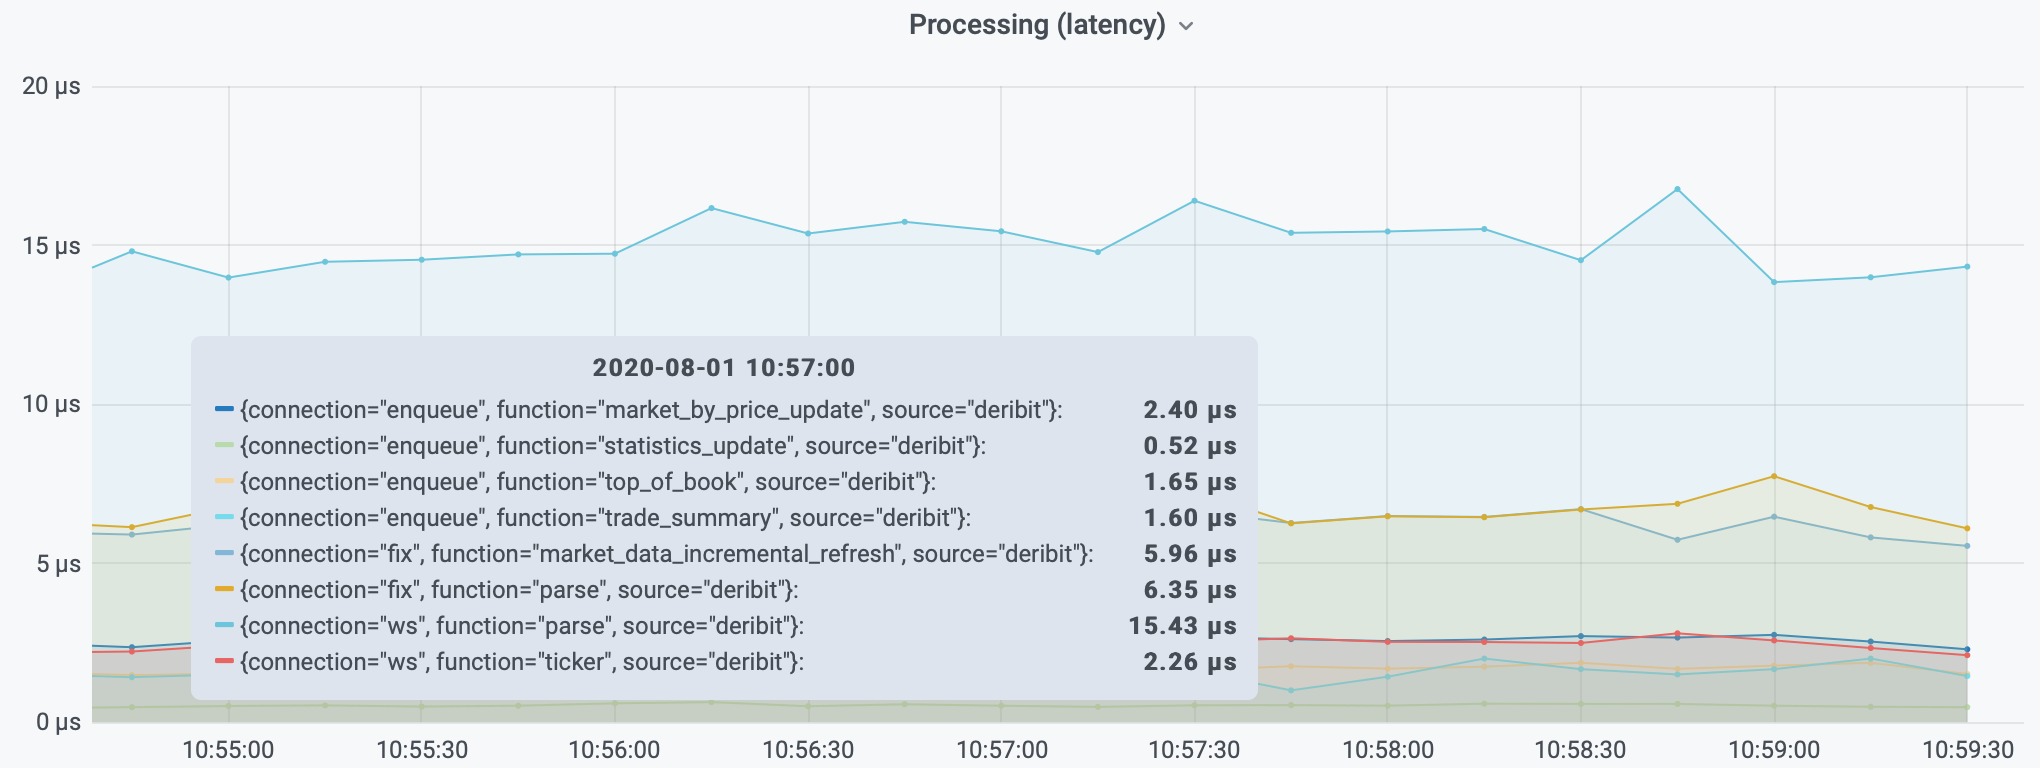
Prometheus can be configured to automatically scrape this information.
Grafana is a dashboard solution allowing you to chart the data collected by Prometheus.