Latency Analysis (Deribit Gateway)
The purpose of this document is to profile tick-to-trade latencies for the roq-deribit gateway.
Note
It has been a long time since we published the first Latency Experiment. Many new features have been added and the latency profile needs to be reviewed again. This document will serve as a base-line for future optimizations.
Summary
Median tick-to-trade latency measured to 9μs.
Sampled tick-to-trade latencies ranged from 7μs to 25μs.
Conclusions
Median tick-to-trade latency in the expected range (<10μs).
Tail latencies larger than expected.
Note
We didn’t expect tick-to-trade latencies to be extremely low due to the deep order book (>500 price levels) and the protocol being standard FIX requiring encoding/decoding of human-readable numeric values.
The following topics should receive further attention:
Gateway must give priority to incoming client requests (order actions).
Priority is currently given to the processing of all pending inbound socket data (e.g. market data).
Solutions should be found to keep L1/L2 caches warm and also to more aggressively prefetch cache-lines from the shared memory queues.
Current analysis appear to show latency spikes which could relate to cache contention, poor prefetching or even interrupts.
Explicit prefetching was dropped during this review due to uncertainties around the benefits. (Prefetching was used without any actual profiling.)
Some code paths appear to be overly expensive, e.g. request validation and OMS object caching.
There has been no attempt to optimize these particular code sections during this review.
A general review is needed to reduce number of cache-lines required in the hot path.
Challenges exist because some exchanges publish very deep order books (>100k price levels).
Deribit
Some reasons why the Deribit gateway is a good starting point for creating a base-line benchmark:
FIX protocol has lower encoding/decoding overhead.
Most crypto exchanges only offer JSON based protocols.
No signature required for sending order actions.
Most crypto exchanges typically use JSON/REST protocols and require HMAC-SHA256 signing.
Public data are disseminated in real-time as an incremental feed.
Some exchanges throttle updates and only provide a conflated market data feed. For example, Binance will potentially publish 100s of updated price levels every 100ms.
Market by Price is full depth often having 100s of active price levels (>500 should be expected).
This is reasonably complex and will allow us to detect L1/L2 cache issues, particularly when price levels are added and/or removed from the book.
Public data can optionally be received as SBE/multicast.
Although we don’t use this particular feed for this analysis, it being available shows that the exchange is moving towards a more traditional low-latency setup.
However, some exchange features make the test less than optimal:
Rate limits can be quite restrictive.
Design
This analysis is focused on measuring tick-to-trade latencies as measured from data arriving on a socket until a request is sent out on a socket.
Note
We only measure between socket hand-off to user-space and user-space requesting a socket send and flush. The more standard measurement is wire-to-wire which includes hardware (NIC) timestamping and wire-tap. However, the focus of this analysis is entirely on user-space software performance using a standard Linux network stack.
Note
It is important to consider the software design when comparing to other low latency software solutions. The focus should be on comparing to other EMS/OMS solutions also implementing a distributed design. In particular, true HFT applications are typically single threaded (if even software based).
Measurements by the gateway leverage roq::MessageInfo which is a generic
solution used to track various timestamps.
Note
These timestamps are typically used by a receiver to answer questions about processing times of the prior step (the producer) and also to identify the age of the message that was the origin trigger. This is described in the Latency design document.
This is a high-level view of the steps and measurement points:
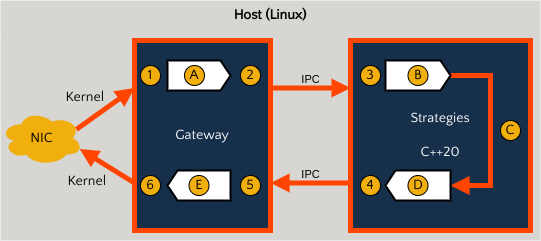
Data read from socket buffer.
Decode FIX message, update internal object cache.
Internal message encoded and transmitted using shared memory queue.
Internal message received.
Decode message, dispatch to event handler.
Logic specific to the strategy.
Order action request (trivial validation).
Internal message encoded and transmitted using shared memory queue.
Internal message received.
This step is broken into “server” and “gateway”.
Data written to socket buffer + socket requested to flush all data..
Note
The terms “server” and “gateway” relate to the separation implied by the following implementation choices:
The
roq-serverlibrary provides generic low-level utilities for all gateway implementations.Each gateway then implements exchange specific protocol encoding/decoding.
Results
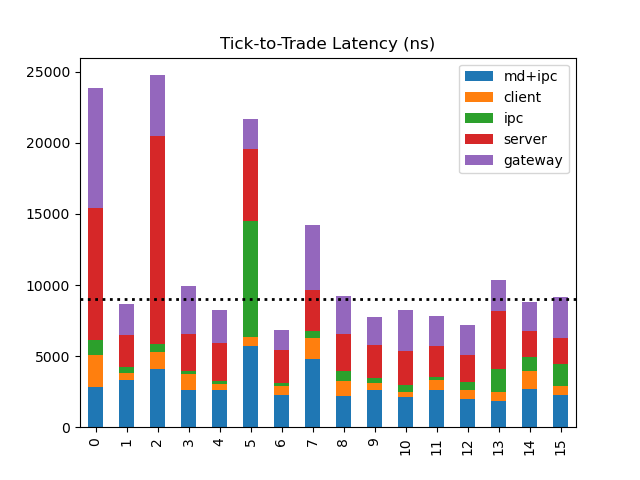
The entire bar measures
(1)→(6).md+ipcmeasures(1)→(3).Latency is introduced when the client is busy and not immediately ready to process an incoming message.
clientmeasures(3)→(4).ipcmeasures(4)→(5).Latency is introduced when the gateway is busy and not immediately ready to process an incoming message.
serverpartially measures(5)→(6). It is the “server” part of(E).gatewaypartially measures(5)→(6). It is the “gateway” part of(E).
Note
The linked notebook contains raw data and further break-down of the
(5) → (6) measurements.
Configuration
$ lscpu | grep 'Model name' | sed 's/^.*: *\(.*\)$/\1/g'

AMD EPYC 7443P 24-Core Processor
$ lscpu | grep 'Thread(s) per core' | sed 's/^.*: *\(.*\)$/\1/g'

1
$ lsb_release -d

Description: Ubuntu 22.04.1 LTS
$ cat /proc/cmdline

BOOT_IMAGE=/vmlinuz-5.15.0-57-generic root=/dev/mapper/ubuntu--vg-ubuntu--lv ro isolcpus=3,4 rcu_nocbs=3,4
$ cat /etc/default/irqbalance  | grep IRQBALANCE_BANNED_CPULIST

IRQBALANCE_BANNED_CPULIST=3,4
$ tuned-adm active

Current active profile: network-latency
Gateway flags
--loop_cpu_affinity=3
--loop_sleep=0ns
--loop_timer_freq=25ns
--enable_round_trip_latency=True
Client flags
--loop_cpu_affinity=4
--loop_sleep=0ns
We use default logging (ROQ_v=0) for both gateway and client.