Service Management
Design
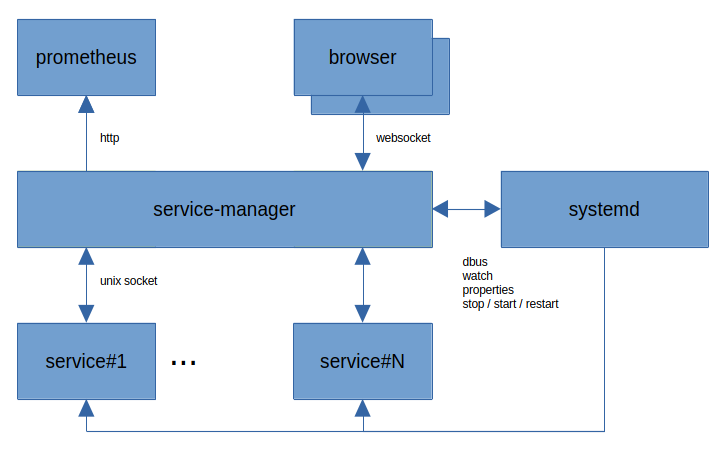
The Service Manager
Connects to the host’s service manager to control and monitor a set of configured services.
Subscribes and caches “state” from each of the connected Services.
Allows browser clients to connect via WebSocket.
Allows Prometheus to connect and scrape metrics for all the connected Services.
Constraints
The Service Manager only works with systemd/dbus-based Linux distributions.
Systemd
Many Linux distributions use dbus as the communication bus and systemd to manage Services.
There are typically two dbus instances: one for root and one users.
Note
The --systemd_scope flag should be used to select the correct dbus instance.
The Service Manager will watch events on dbus to monitor current state of each of the configured Services. When the state changes, the Service Manager will request current systemd properties and make this information available to all connected clients.
Clients can send requests to stop/start/restart the configured Services. Receiving such a client request will be forwarded as a dbus request and dbus monitoring will result in changed state to be published to all connected clients (as mentioned in the previous sub-section).
This functionality is therefore complimentary to existing command-line functionality such as
systemctl [stop|start|restart] ....
Prometheus
Connected Services will automatically publish Prometheus metrics to the Service Manager. This is being published on a timer, typically every second.
The Service Manager will cache Prometheus metrics in memory as text “blobs”.
Prometheus can then connect to the Service Manager and request (just once) the metrics of all connected Services.
Service State
Connected Services will always publish their internal state to the Service Manager.
Technically, the Services run a secondary thread listening to the messages sent on the shared memory queues. This thread ill re-format the message as JSON, cache it in memory, and publish it to the Service Manager, if connected.
Important
This secondary thread does not in any way impact the hot loop of the service.
The initial snapshot sent by the Service to the Service Manager will include a schema.
The Service Manager will cache state as JSON “blobs” per Service, including the schemas. The Service Manager is therefore agnostic to versioning.
Browser Clients
The Service Manager supports a simple WebSocket based pub/sub protocol to push Service state to connected clients.
The Service Manager only forwards JSON “blobs” (including schema with the initial snapshot) and is therefore completely ignorant to how many resources are being managed and what their real data format is.
The Browser Client is responsible for using the schema to render correct output.
The Service Manager also supports a request protocol. This is used to change service state, e.g. request stop/start/restart. This is also used to change data, e.g. Parameters.
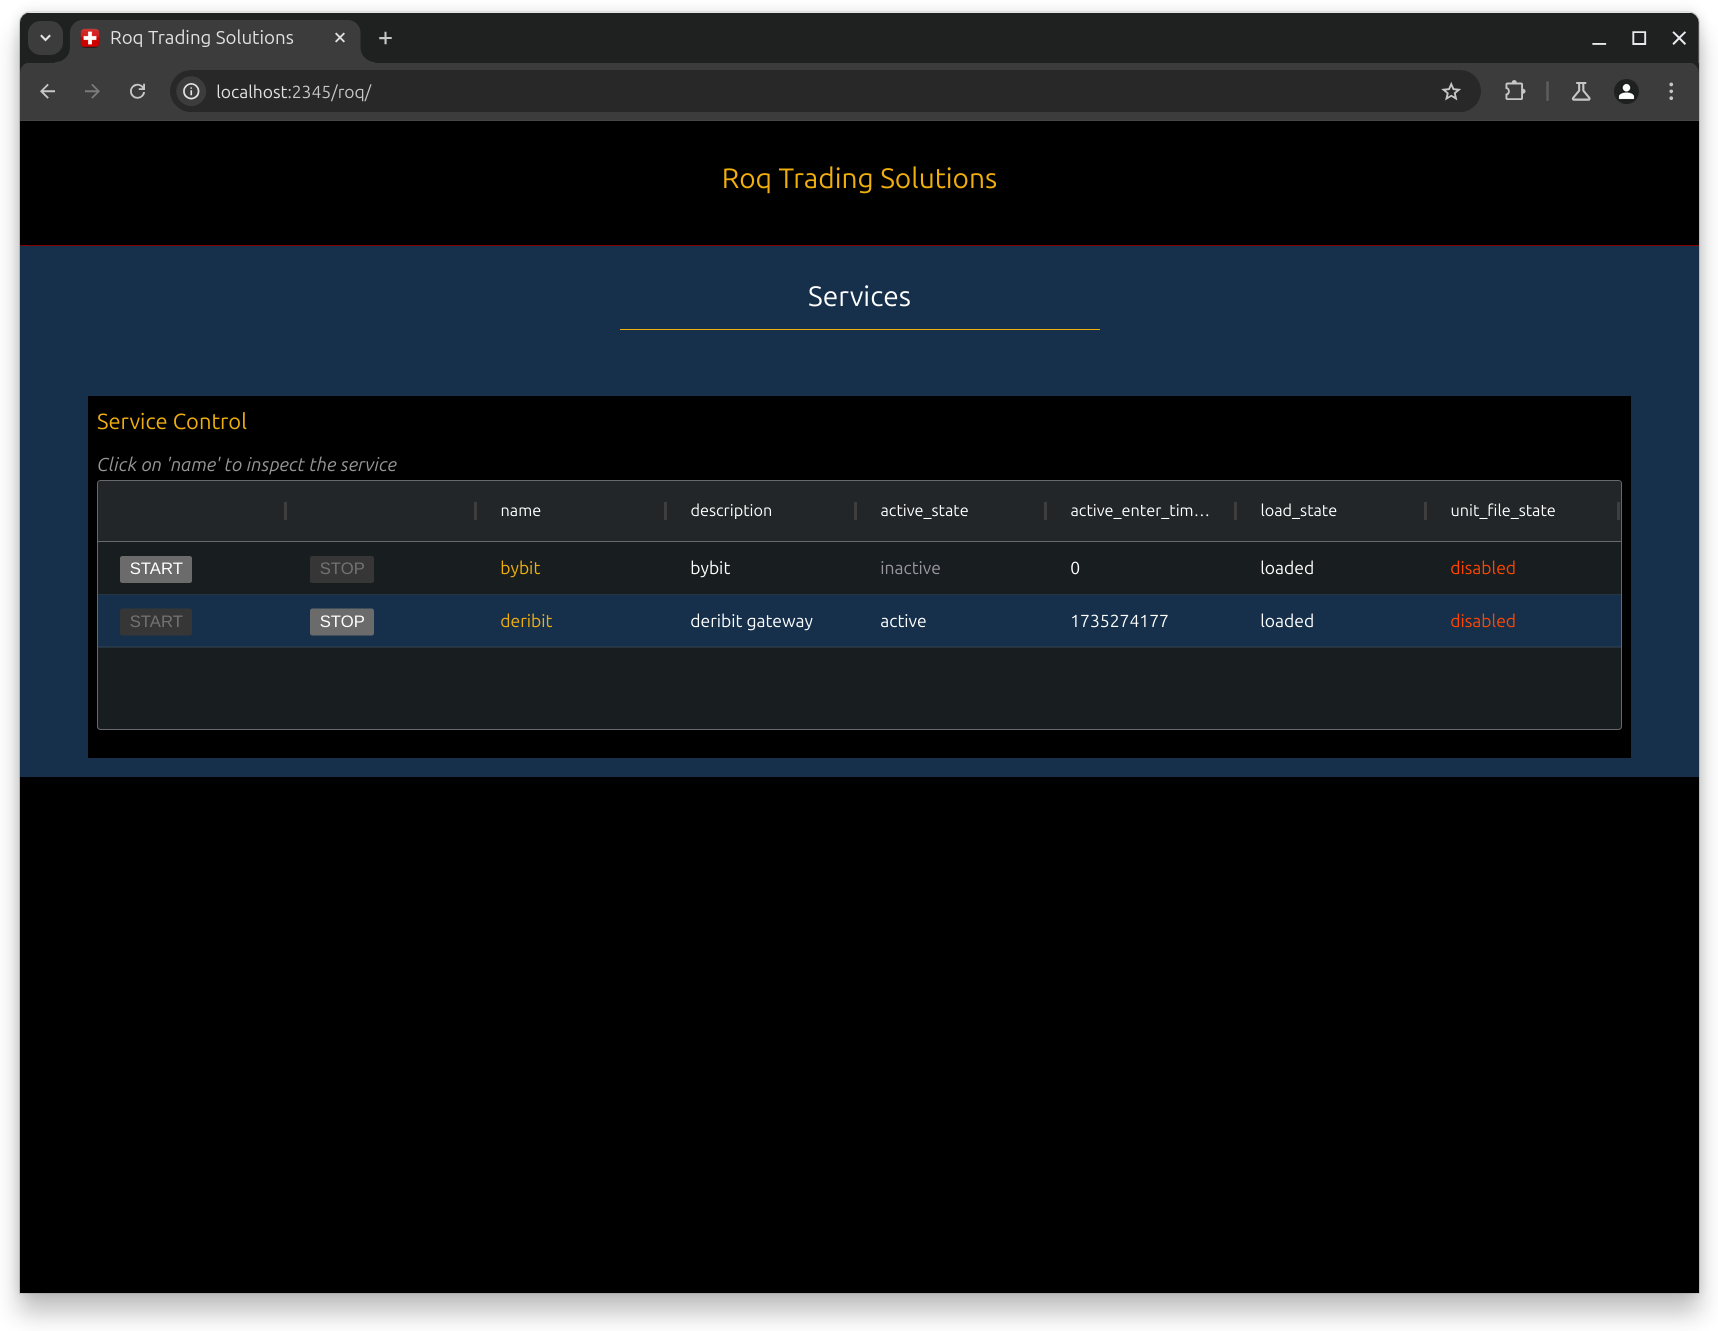
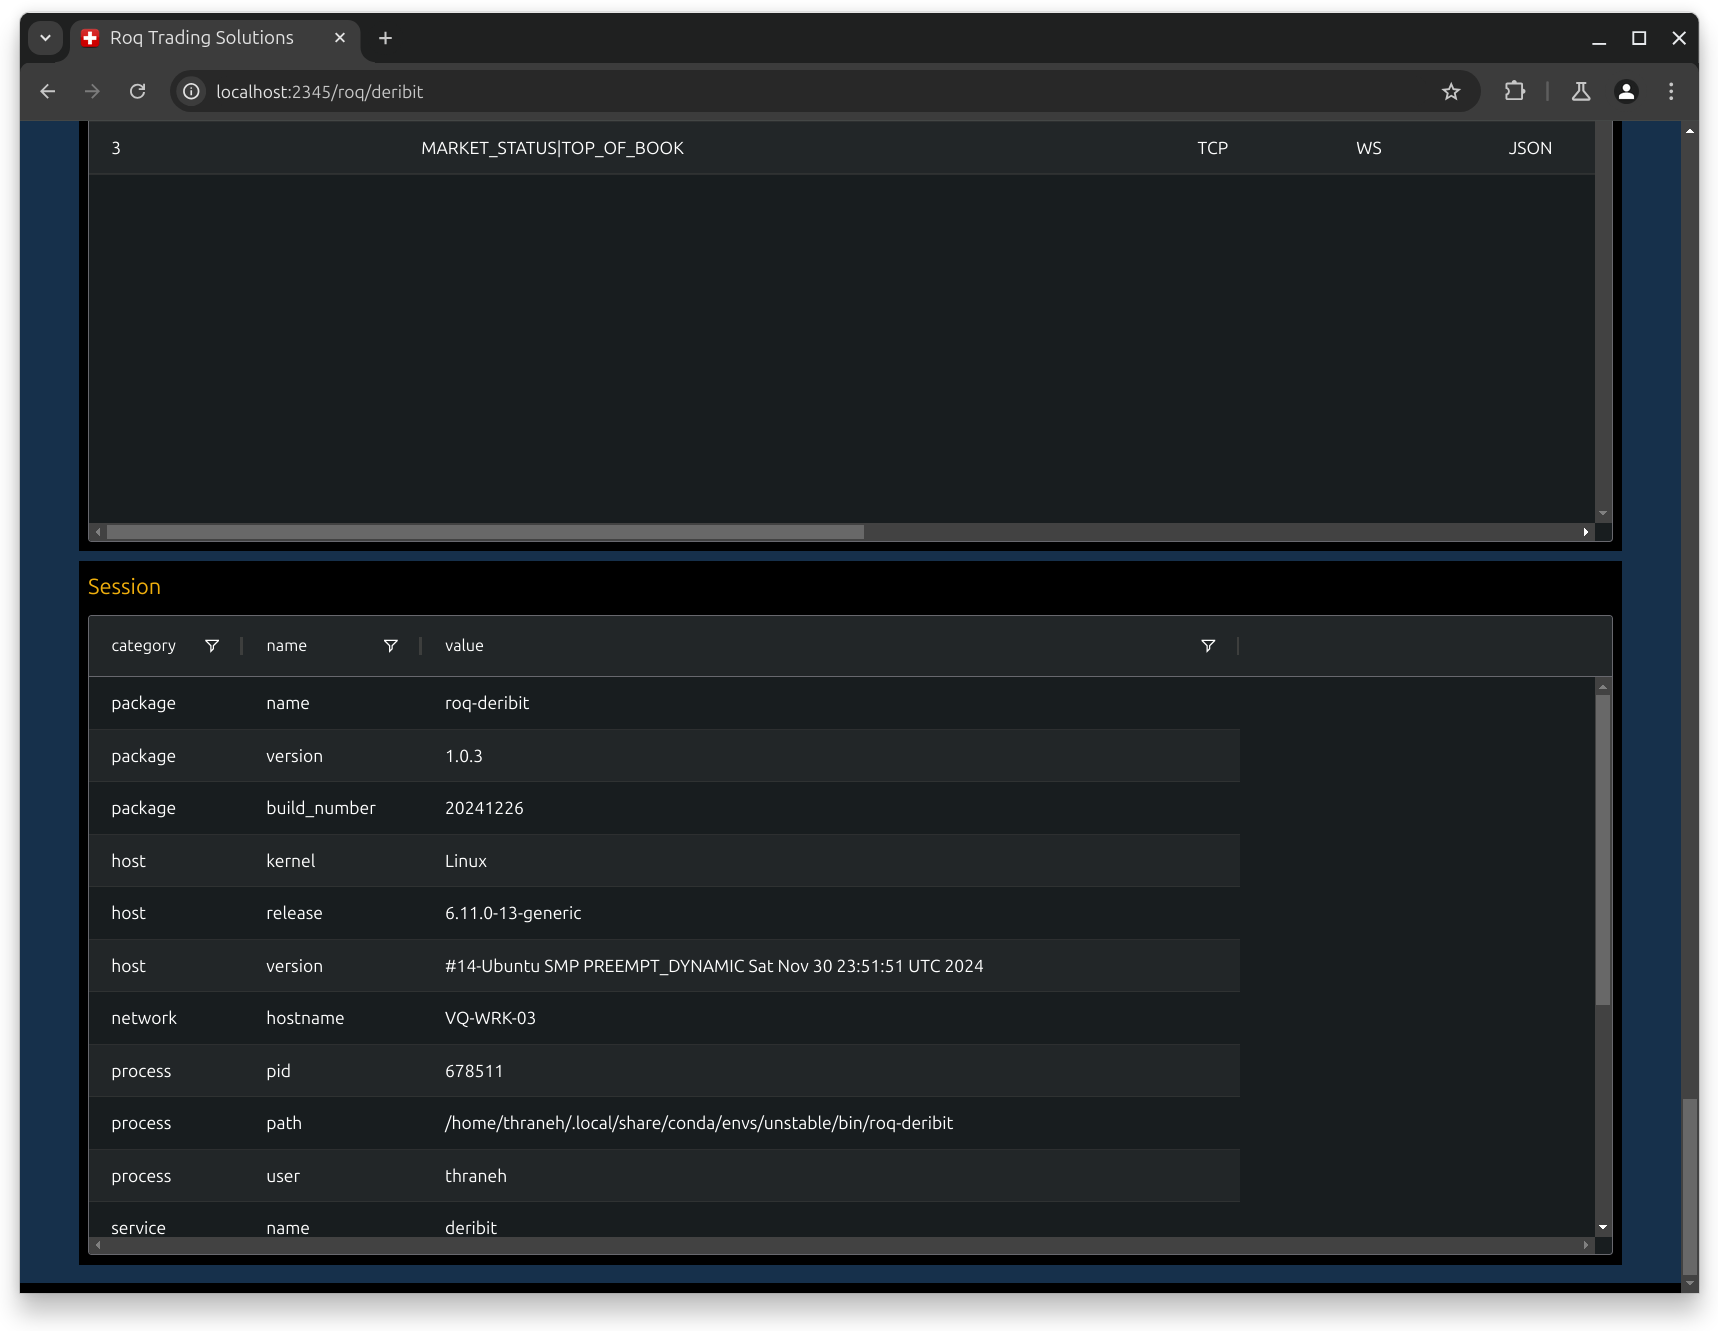
Screenshots
The main screen to monitor and control services
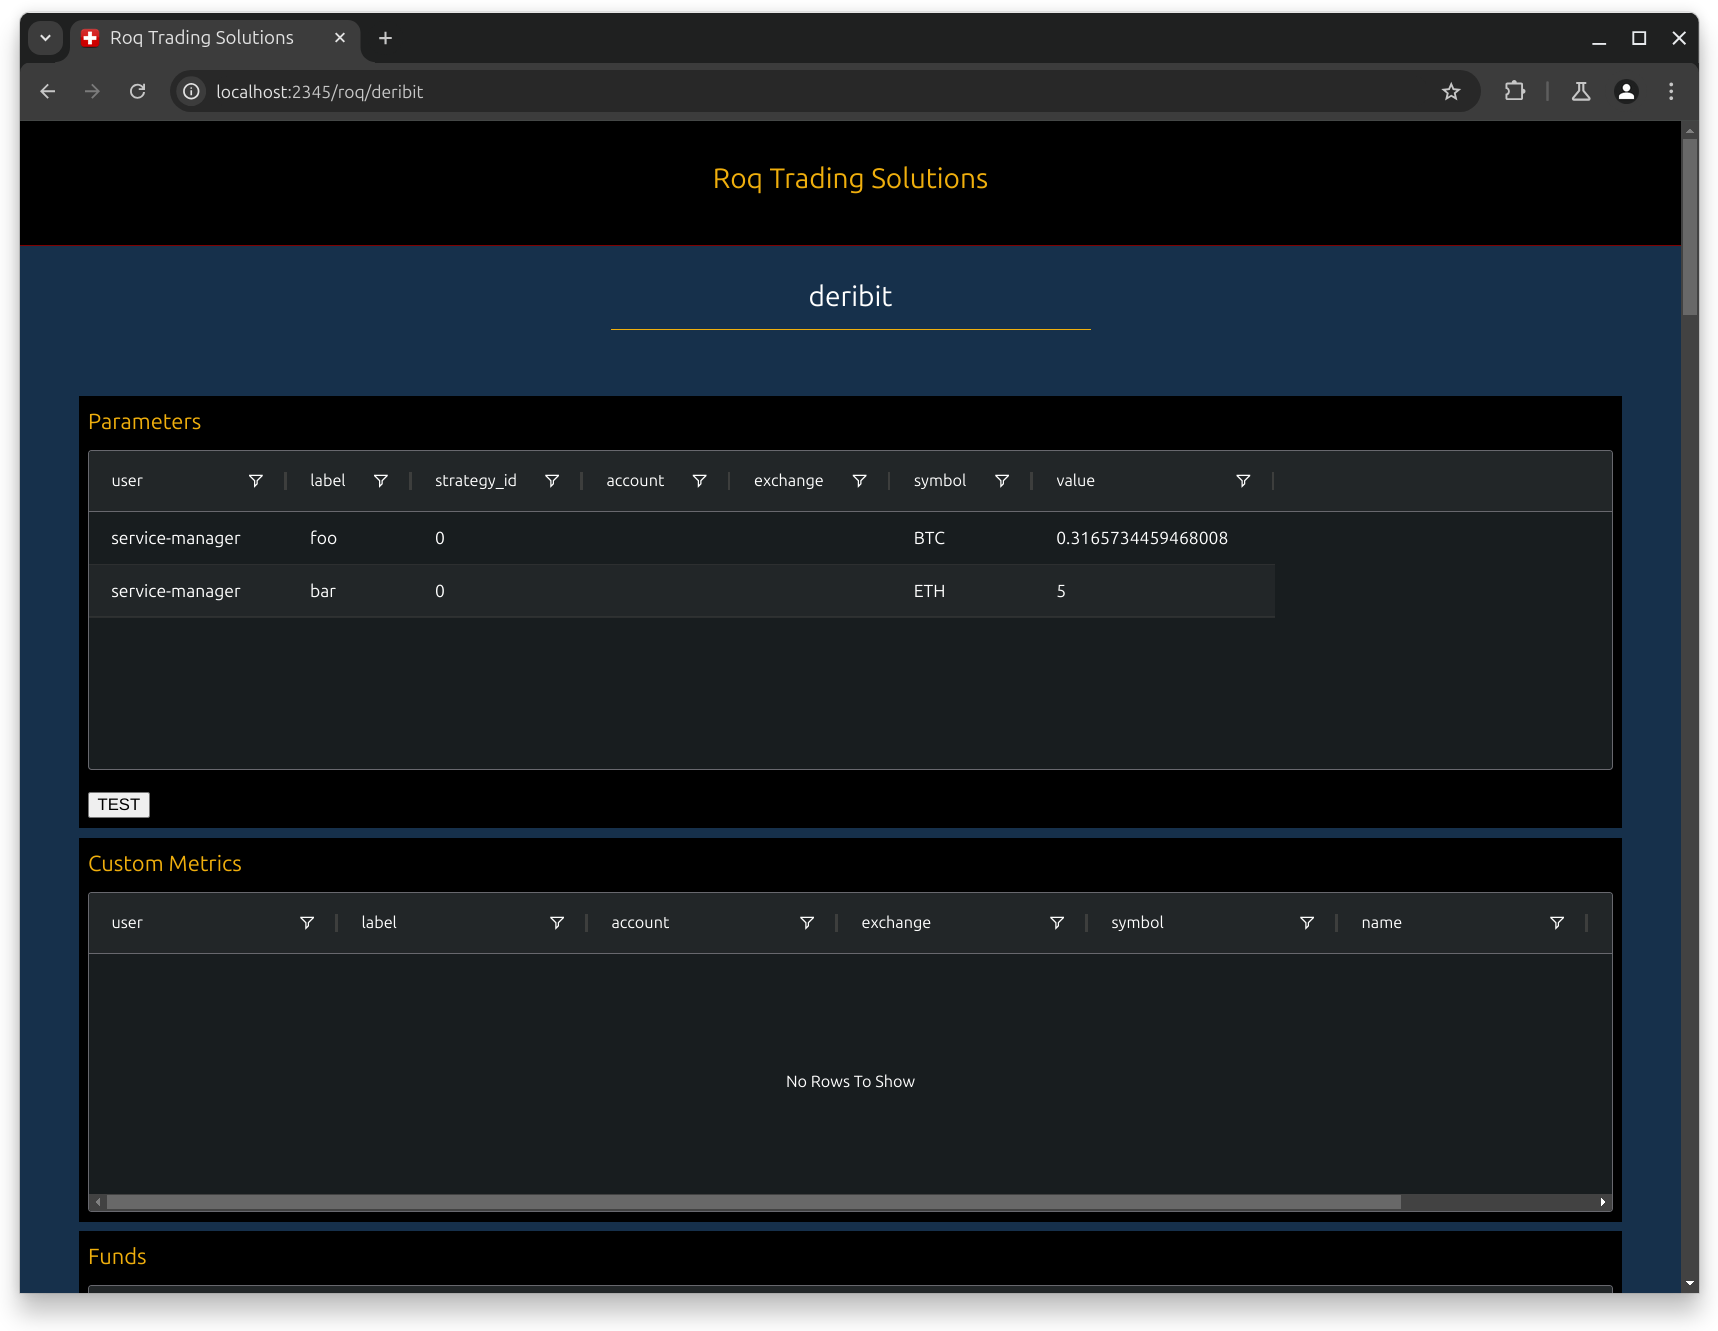
Parameter values can be manually changed (just double-click and edit, change will be submitted on enter)
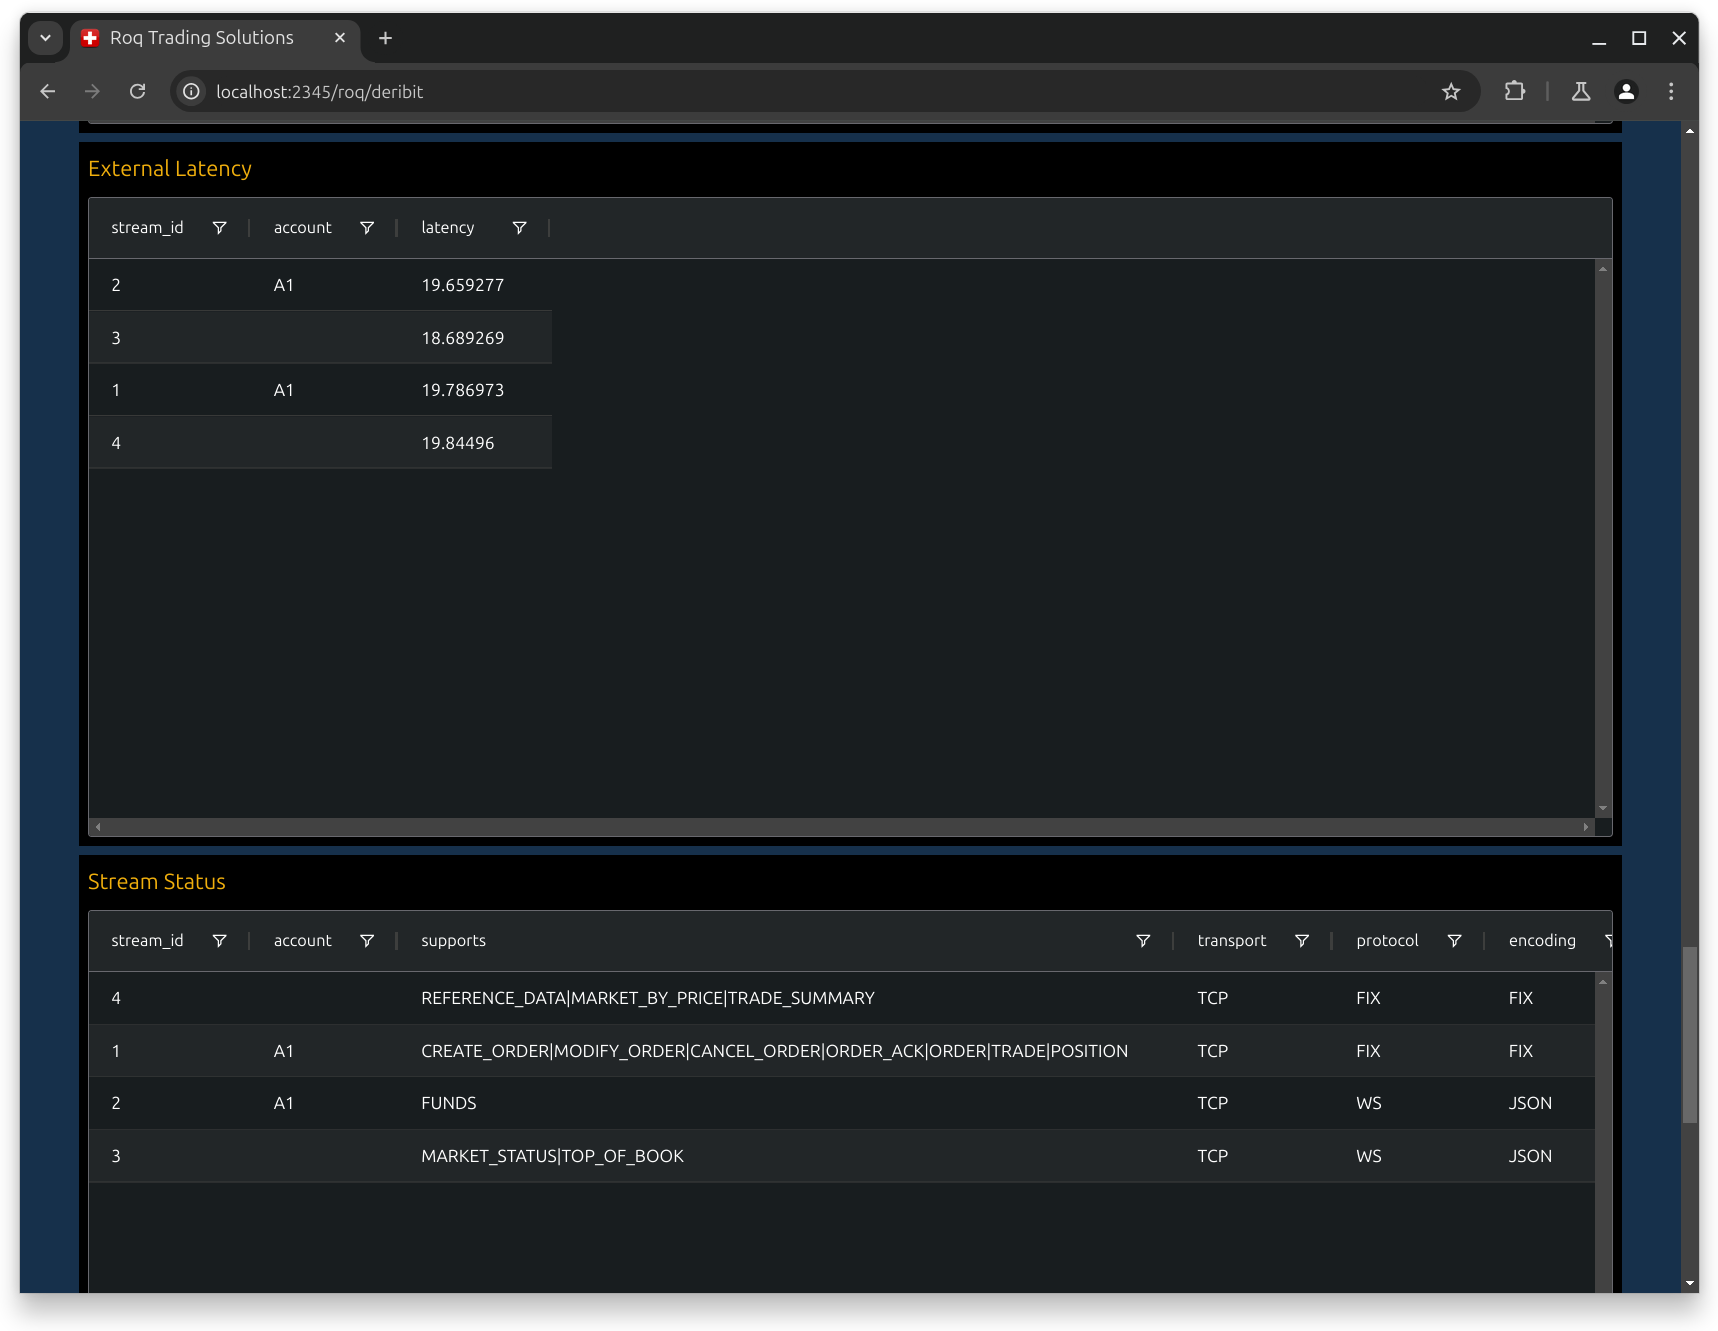
Network streams can be monitored, including ping/pong latency
Sessions parameters can be inspected
… and much more.
Ansible
The roq-ansible project can install and configure all your Services, including the Service Manager.
Q&A
Will this become a proper UI?
The current Vue3 based UI solution has been open-sourced in order to demonstrate some use-cases. Ideally, clients will build their own UIs either by cloning this repository, or by creating their own. The important part is the WebSocket base protocol between browser client and the Service Manager.