Prometheus + Grafana
Observability is very central to the design of the gateways.
A gateway can expose key metrics on a TCP/IP or UNIX domain socket address. This is explained elsewhere (using gateway).
Prometheus
Prometheus can be used to scrape metrics from running gateways.
A very minimal Prometheus configuration file (prometheus.yml)
global:
  scrape_interval: 5s

scrape_configs:

  - job_name: 'roq-deribit'
    metrics_path: '/metrics'
    params:
      format: [ prometheus ]
    honor_labels: true
    static_configs:
      - targets: ['localhost:1234']
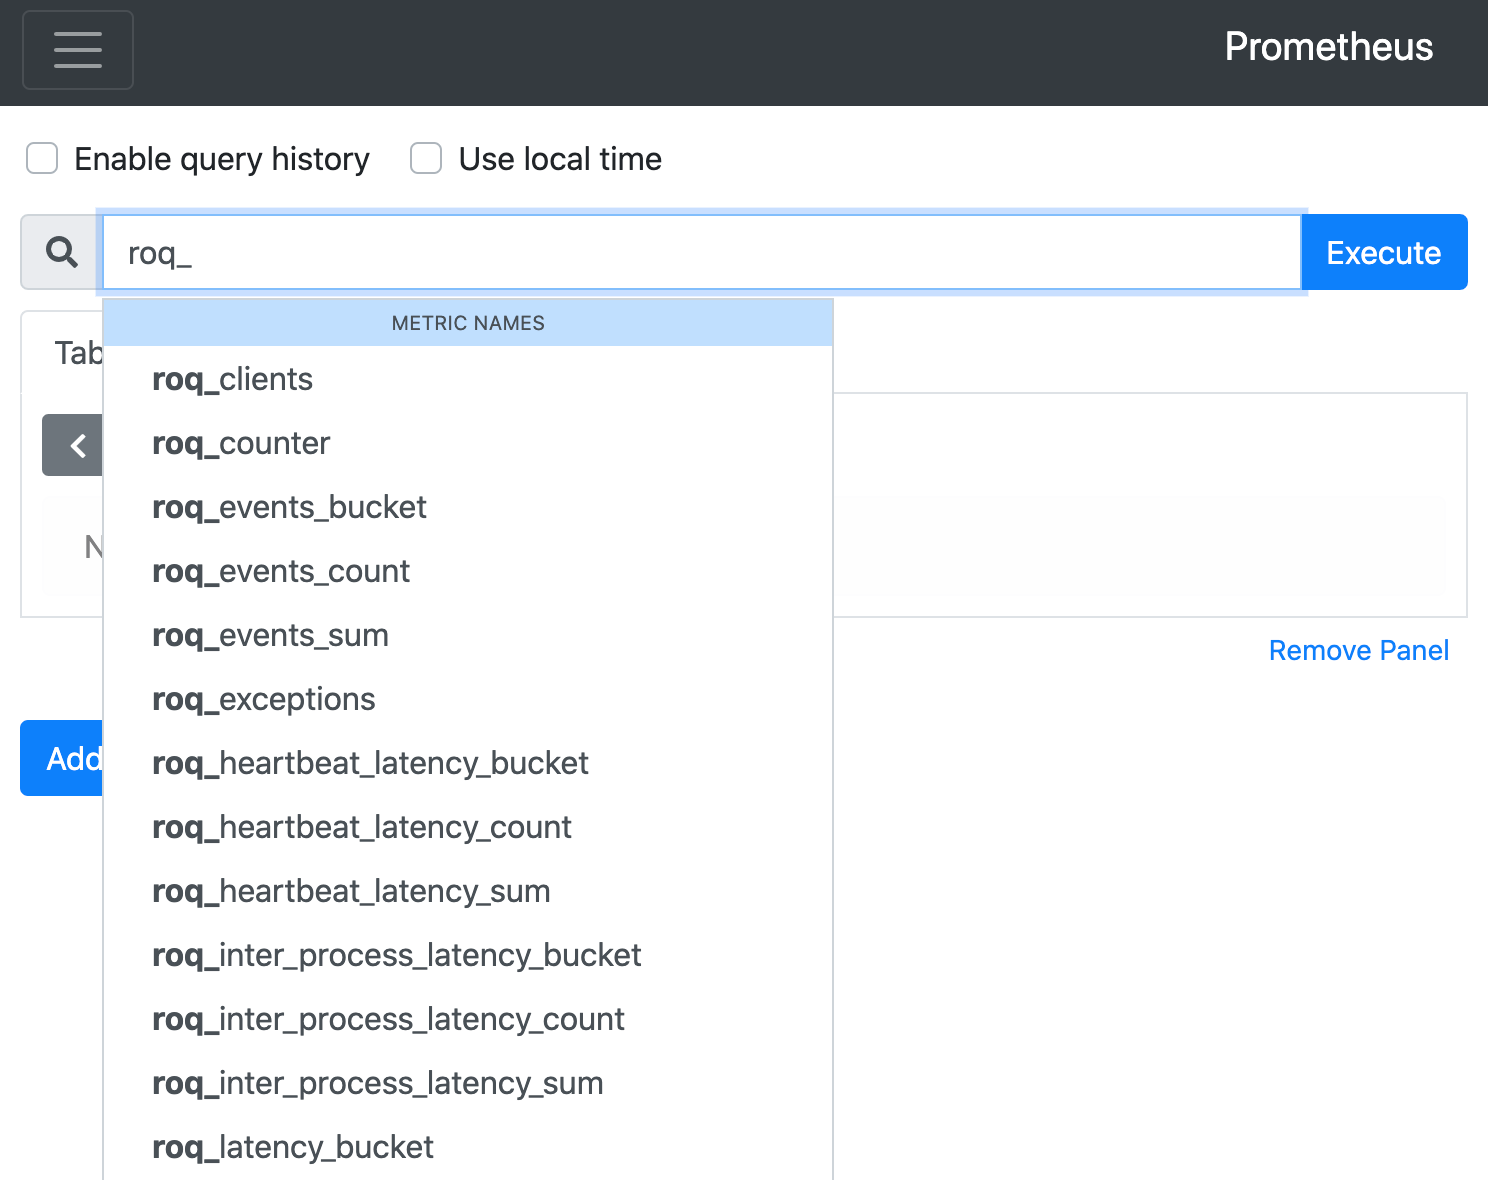
Prometheus provides a browser based UI.
Search
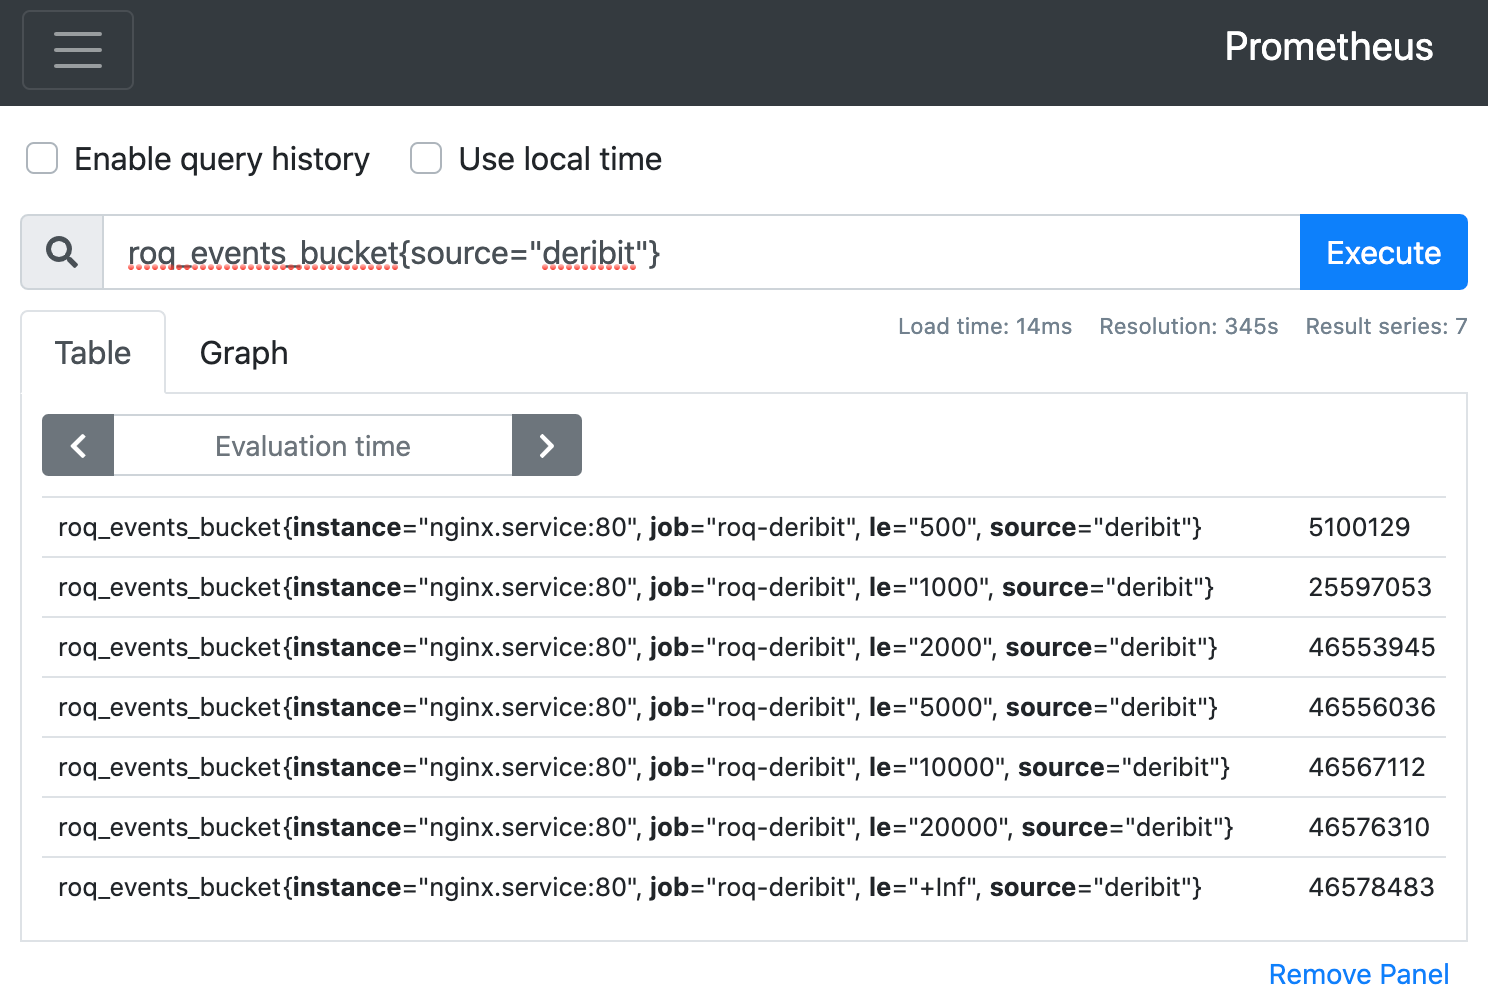
Query
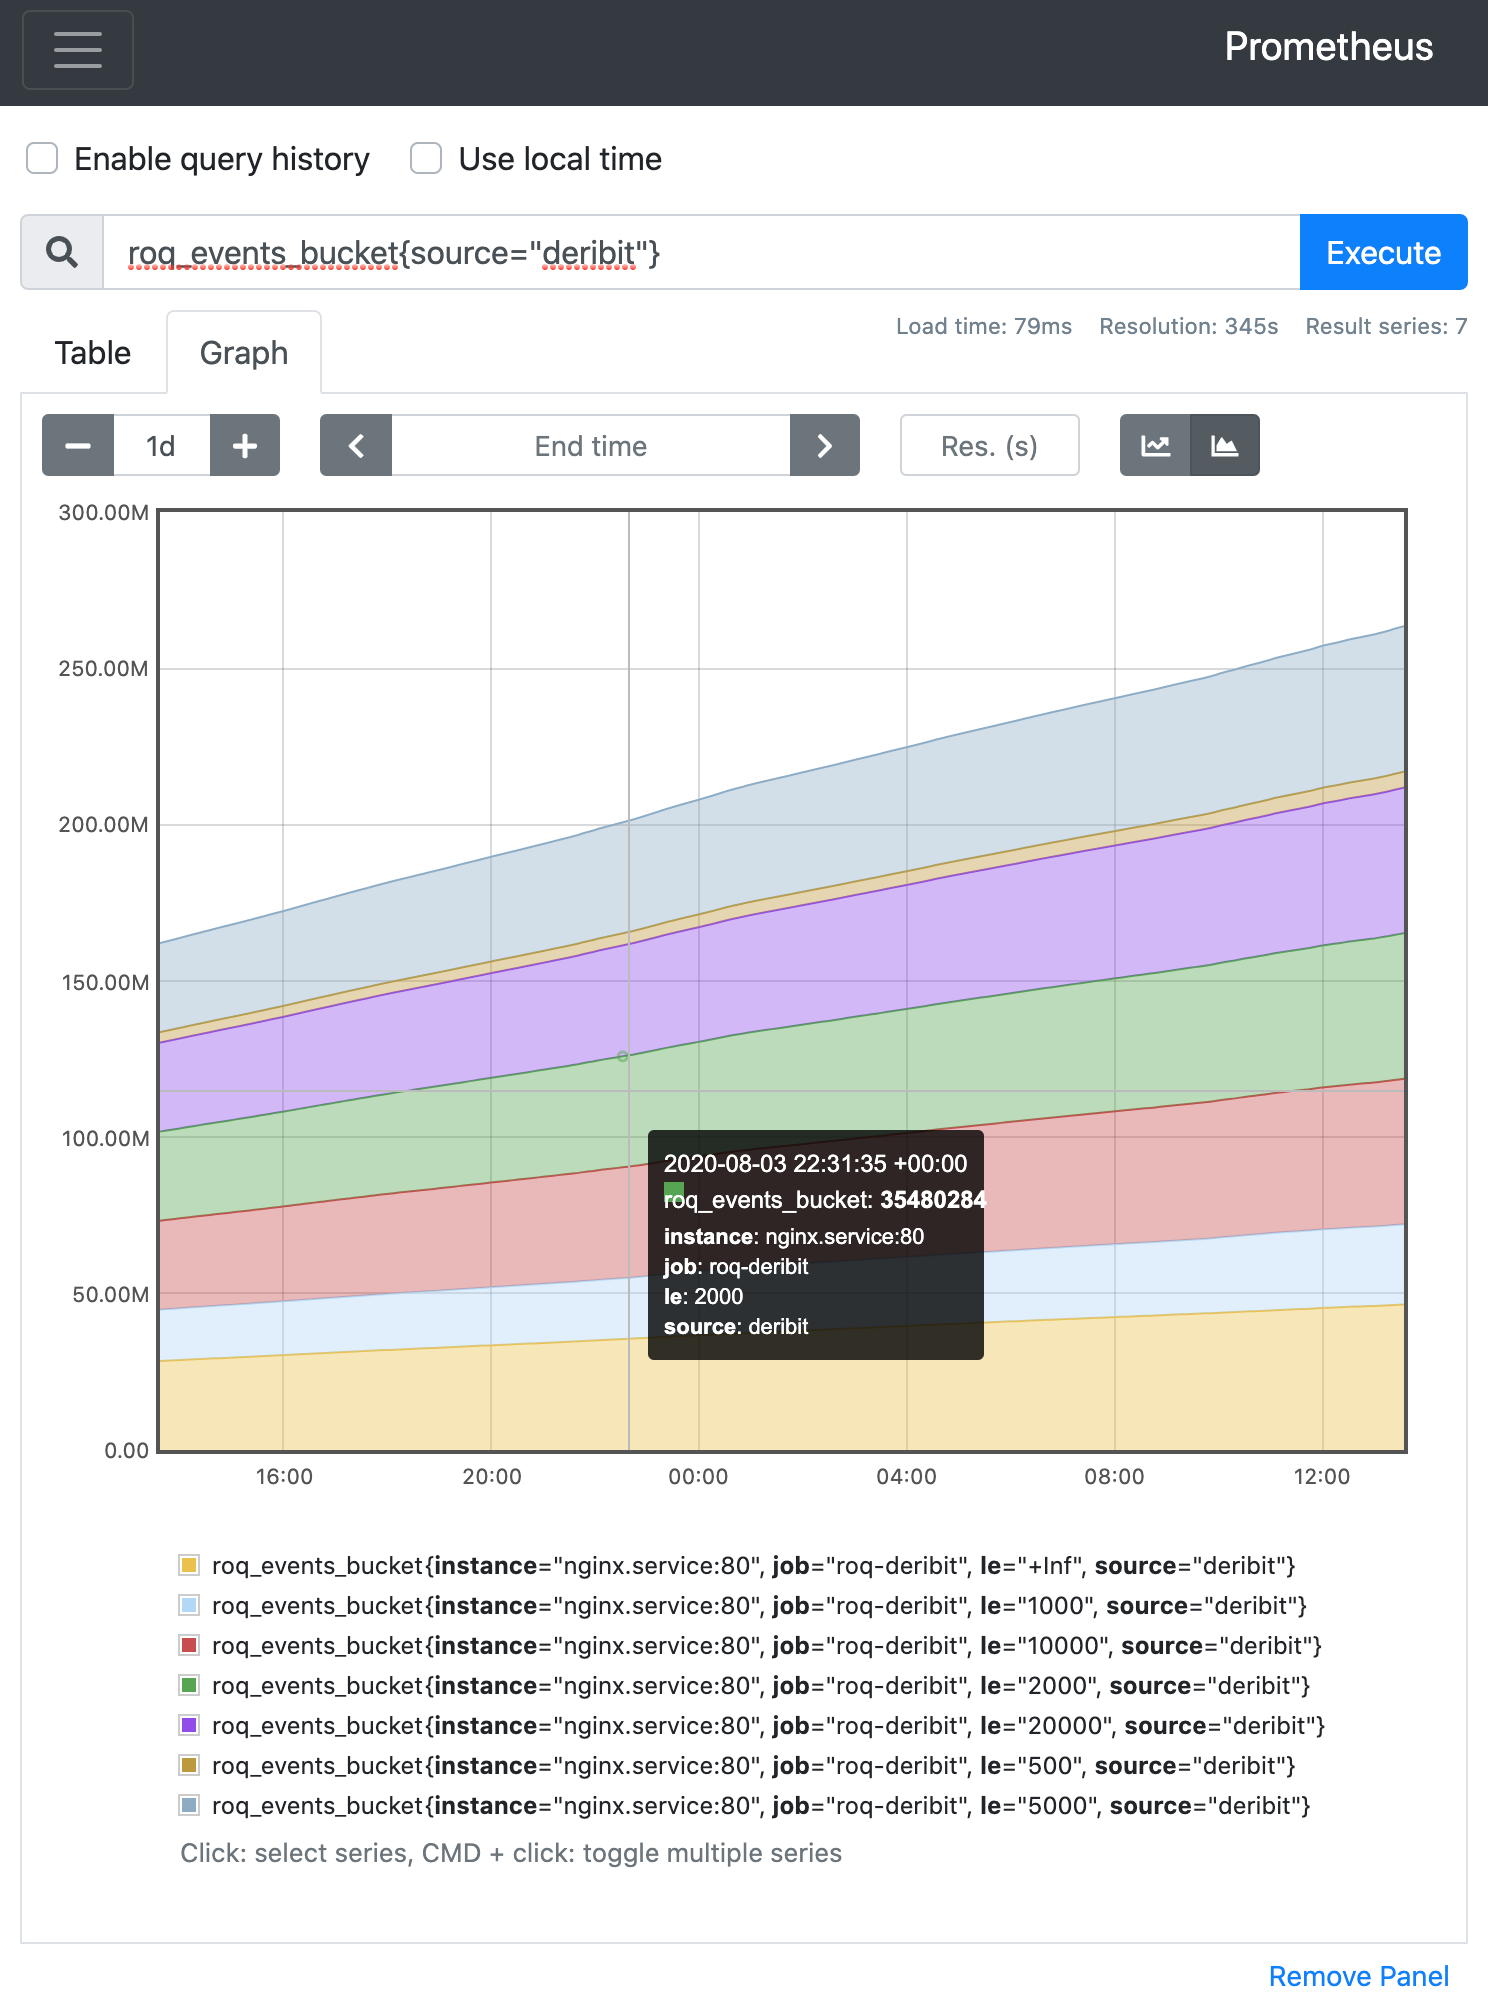
Chart
Grafana
Dashboards can easily be built with Grafana.
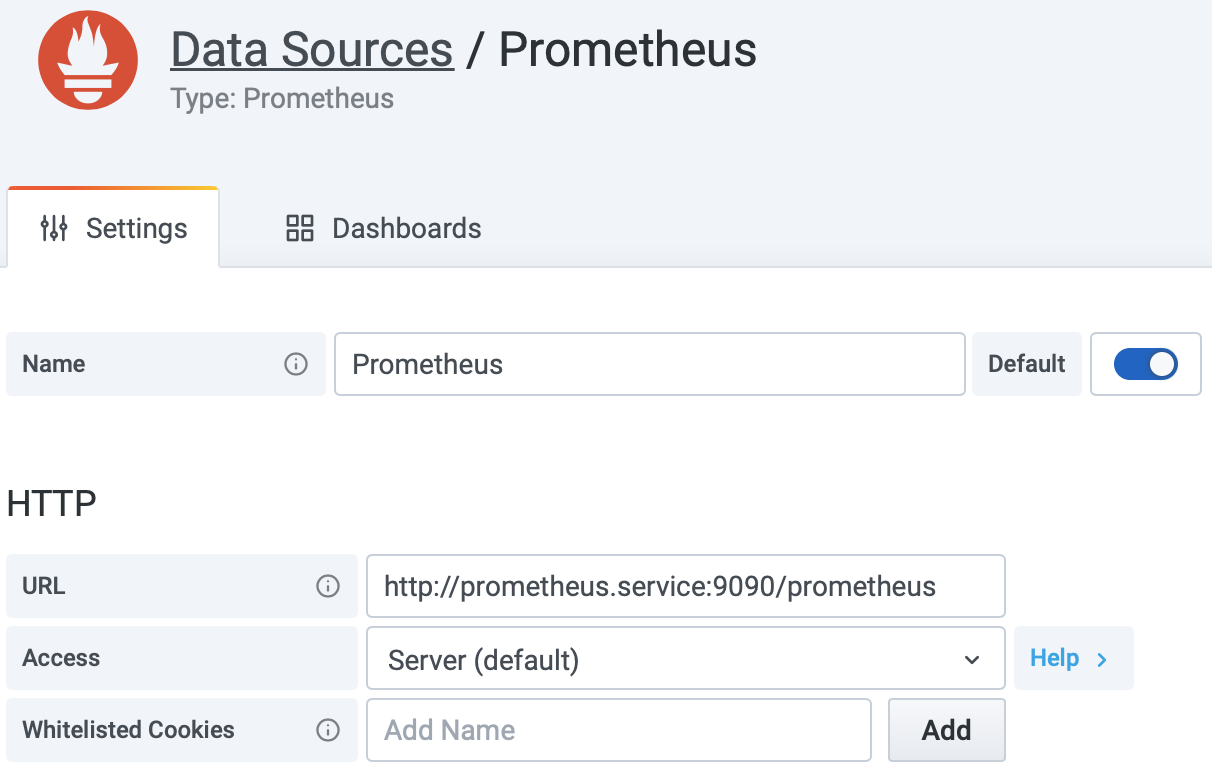
Prometheus can be defined as a data source
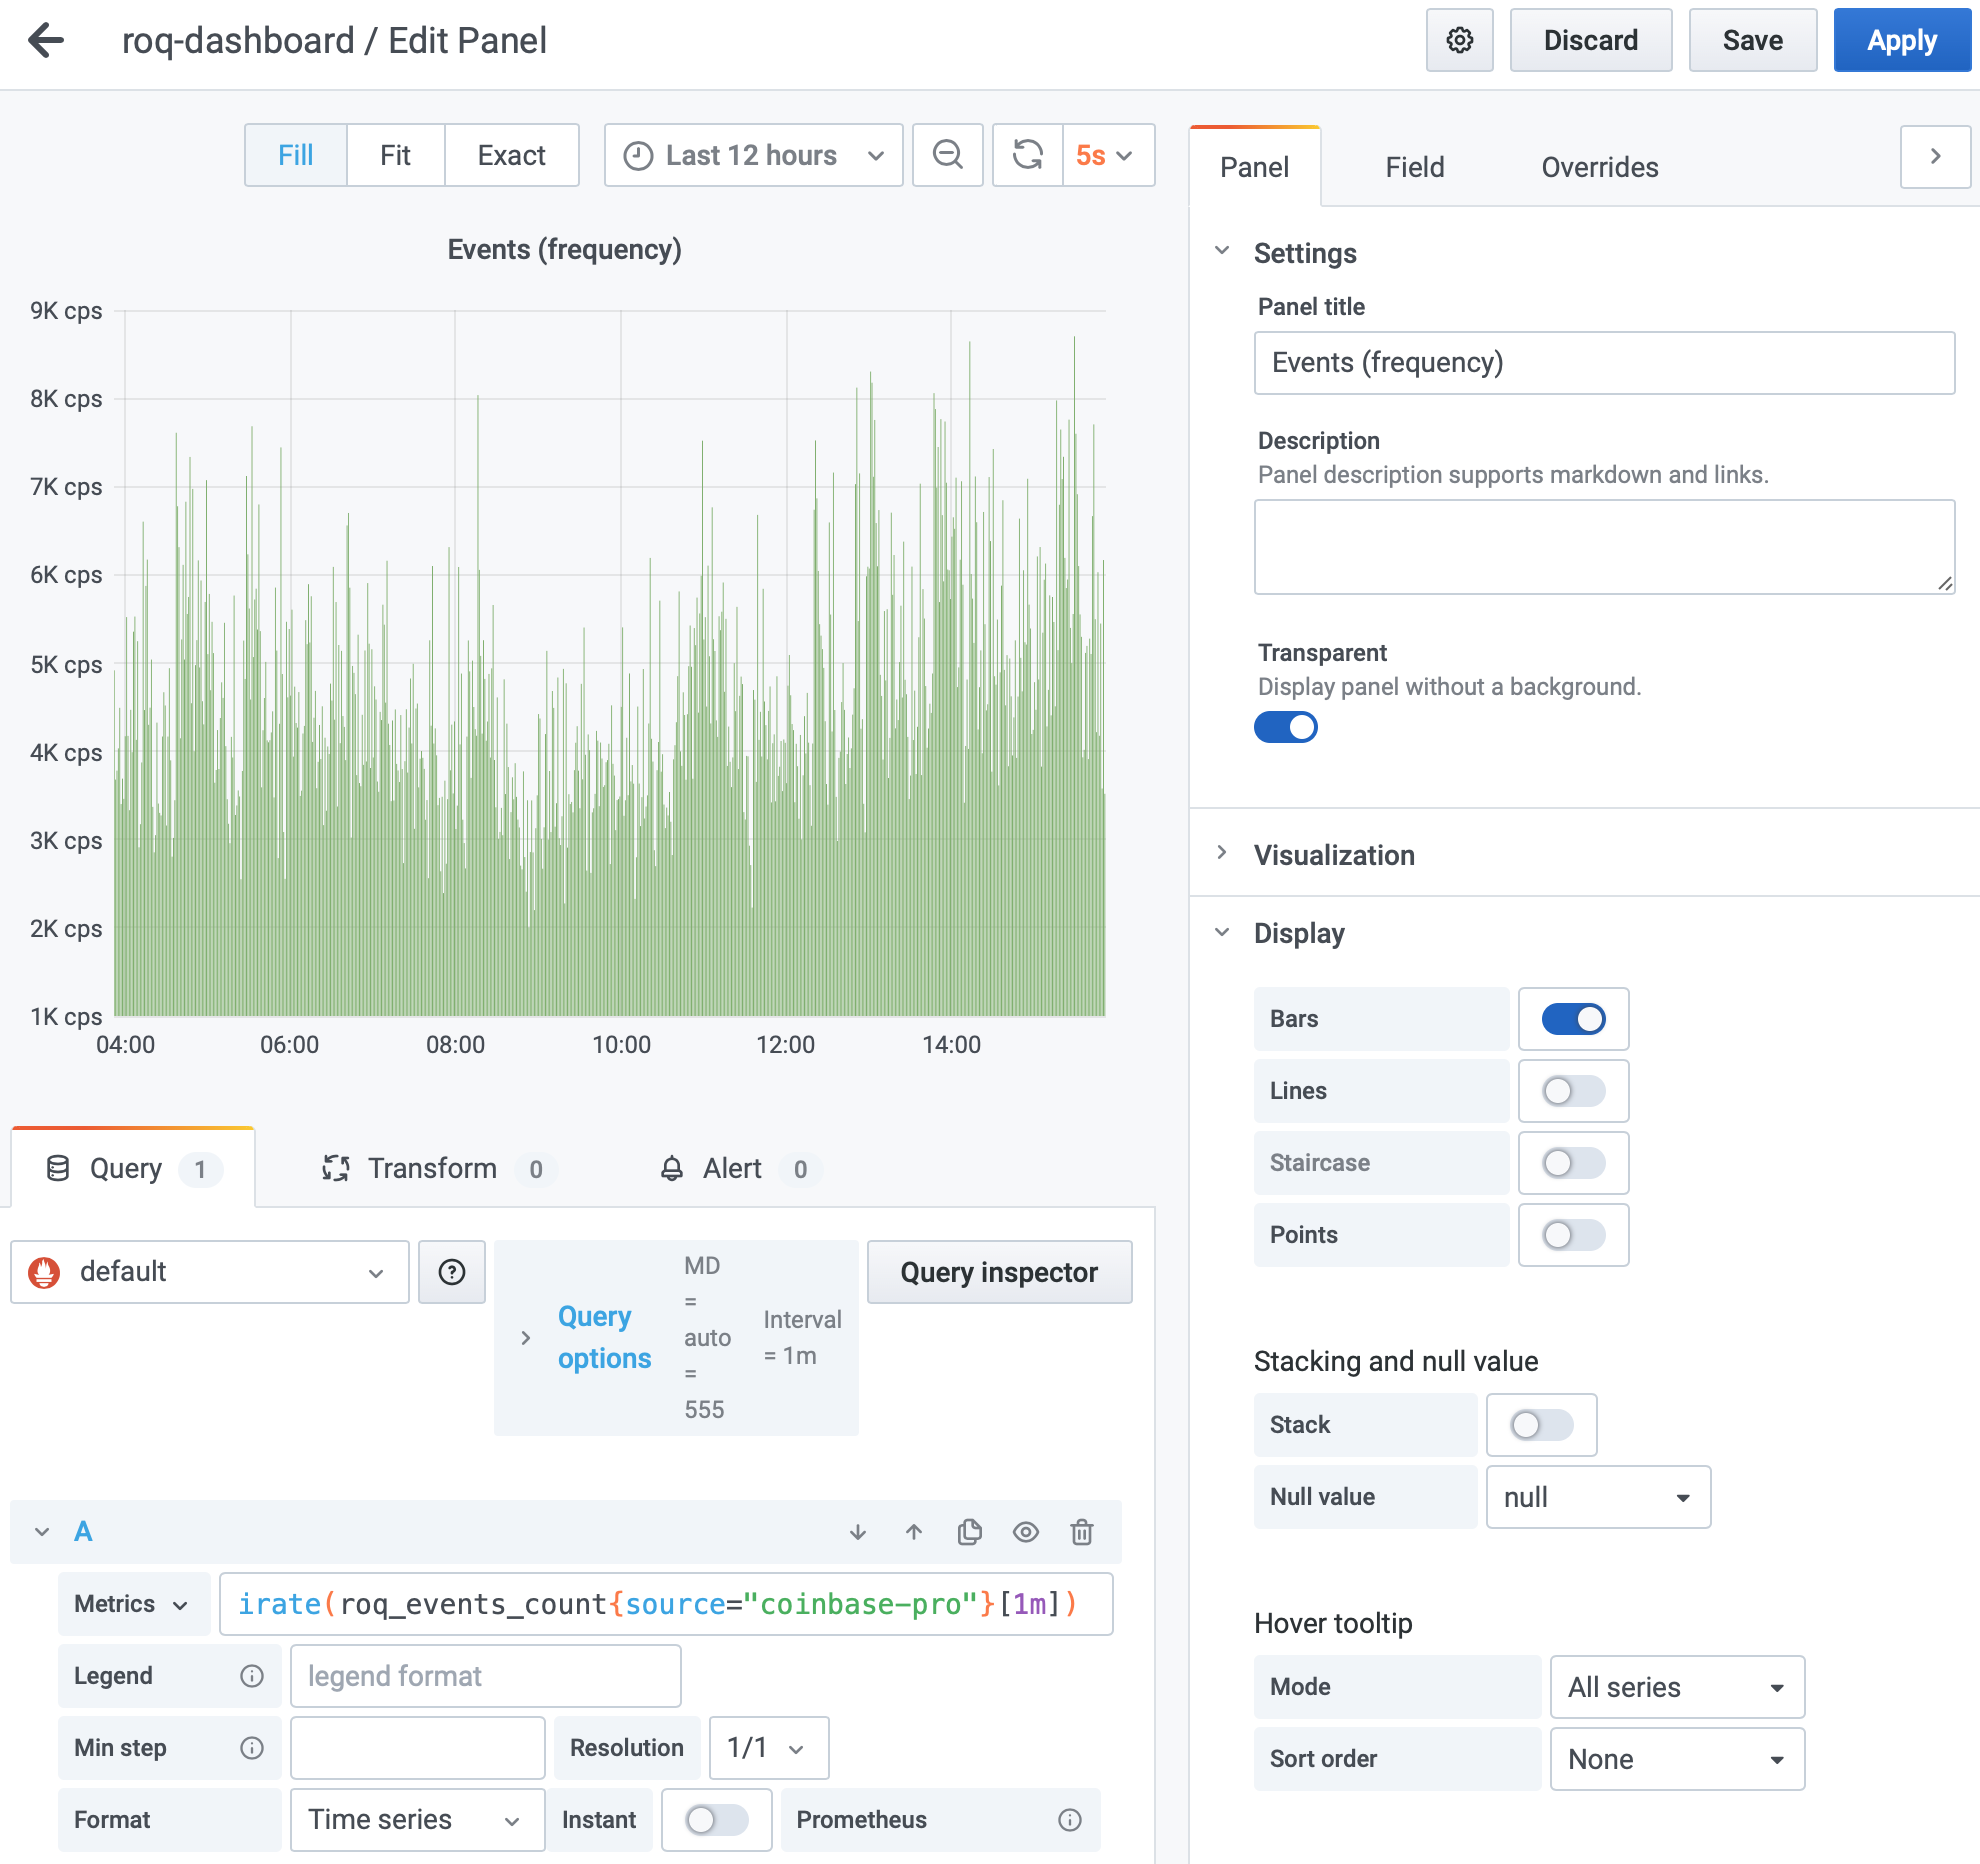
Charts can easily be designed by defining a Prometheus query
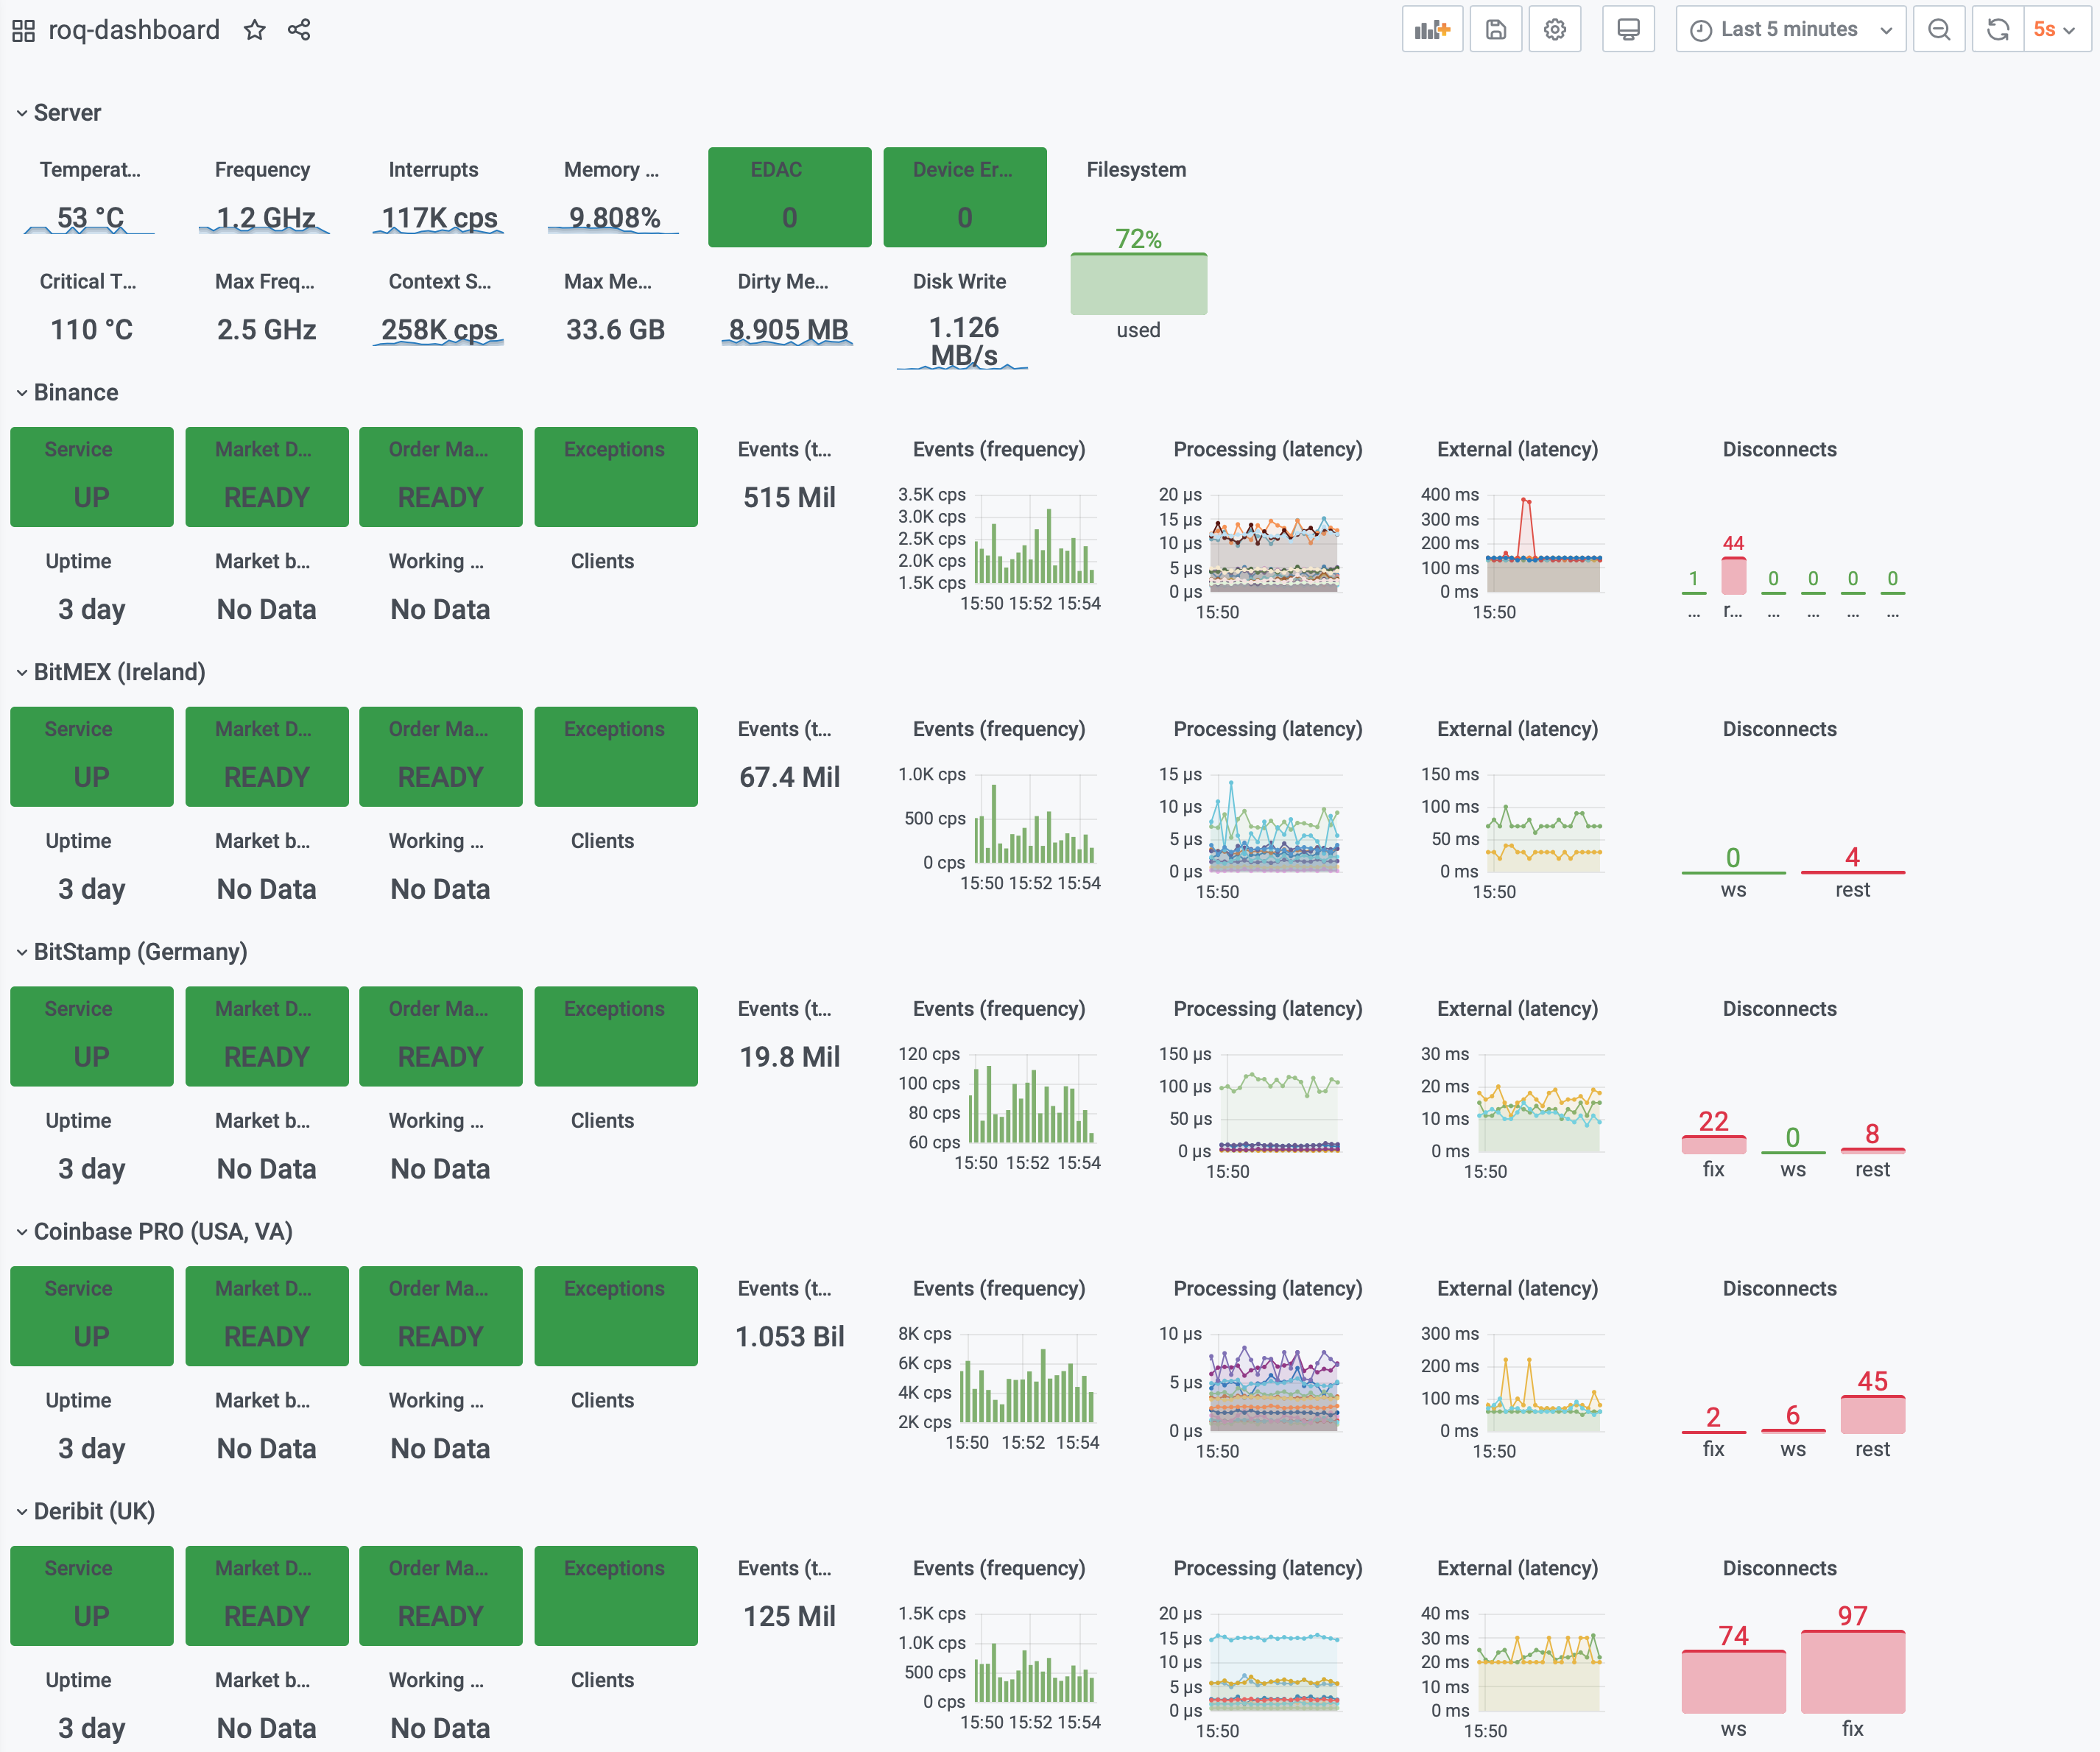
Finally, a dashboard providing a near-real-time view of internal and external latency