Latency Experiment
The purpose is to demonstrate the host specific latency profile using a reasonably realistic trading setup. By following the steps outlined in this document, you should be in a position to measure latencies on your own server configuration.
Summary
The test setup includes a Deribit gateway and two connected clients.

The gateway connects to Deribit’s testnet.
Both clients will automatically respond to ping messages sent by the gateway.
Client #1 will subscribe all symbols from the gateway.
Client #2 is a simple trading strategy which will manage orders through the gateway. This client only needs to subscribe a single symbol.
All components will be configured for low latency.
This document will
Describe
A typical server configuration
How to install and configure the software
How to extract latency metrics from the running gateway
Demonstrate
Function profiling
Internal ping latency
Internal round-trip latency
External latency
Preparations
Platform
This is the server configuration used for testing
AMD EPYC 3251 8-Core Processor
Hyper threading disabled in the BIOS
Ubuntu 18.04 LTS
Kernel boot command-line includes
isolcpu=1-6Dynamic frequency scaling disabled using
tuned-adm profile network-latencyDocker CE installed
Prometheus and Grafana running on same host (as Docker containers)
Note
A true low latency configuration should use RSS (receive packet steering), IRQ balancing, have local timer interrupts disabled, etc. However, these are advanced topics and not required for most use-cases.
Knowing the NUMA architecture is very important if you want to achieve the lowest inter-process latencies
$ lstopo --no-io
Machine (31GB) + Package L#0
  L3 L#0 (8192KB)
    L2 L#0 (512KB) + L1d L#0 (32KB) + L1i L#0 (64KB) + Core L#0 + PU L#0 (P#0)
    L2 L#1 (512KB) + L1d L#1 (32KB) + L1i L#1 (64KB) + Core L#1 + PU L#1 (P#1)
    L2 L#2 (512KB) + L1d L#2 (32KB) + L1i L#2 (64KB) + Core L#2 + PU L#2 (P#4)
    L2 L#3 (512KB) + L1d L#3 (32KB) + L1i L#3 (64KB) + Core L#3 + PU L#3 (P#5)
  L3 L#1 (8192KB)
   L2 L#4 (512KB) + L1d L#4 (32KB) + L1i L#4 (64KB) + Core L#4 + PU L#4 (P#2)
   L2 L#5 (512KB) + L1d L#5 (32KB) + L1i L#5 (64KB) + Core L#5 + PU L#5 (P#3)
   L2 L#6 (512KB) + L1d L#6 (32KB) + L1i L#6 (64KB) + Core L#6 + PU L#6 (P#6)
   L2 L#7 (512KB) + L1d L#7 (32KB) + L1i L#7 (64KB) + Core L#7 + PU L#7 (P#7)
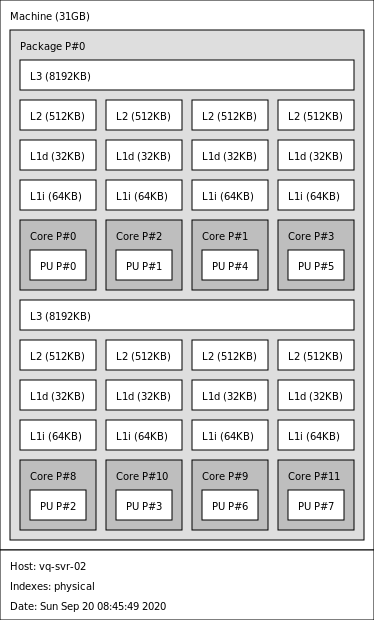
We will be running the gateway on processor #1.
The lowest latencies can be achieved if we run clients on processor #4 and #5 since they reside on the same node as processor #1.
We will include an experiment to measure the cross-connect between the two nodes. That can be achieved by running one of the clients on processor #3, for example.
Further readings
Prerequisites
Download Mambaforge
wget -N https://github.com/conda-forge/miniforge/releases/latest/download/Mambaforge-Linux-x86_64.sh
Install Mambaforge
bash Mambaforge-Linux-x86_64.sh -b -u -p ~/conda
Activate conda
source ~/conda/bin/activate
Note
You should repeat this step whenever you open a new terminal window and you need to access your conda environment.
Install the required packages
conda install \
    --channel https://roq-trading.com/conda/stable \
    roq-deribit \
    roq-cpp-samples \
    roq-test
Further readings
Gateway
Let’s create a config file named deribit.toml.
You can start by copying the template
cp --config_file $CONDA_PREFIX/share/roq/deribit/config.toml deribit.toml
Edit the config file and update with your Deribit API key and secret
[symbols]
  include = ".*"
  exclude = "USDT-.*

[accounts]

  [accounts.A1]
  master = true
  login = "YOUR_DERIBIT_LOGIN_GOES_HERE"
  secret = "YOUR_DERIBIT_SECRET_GOES_HERE"
  symbols = ".*"

[users]

  [users.test]
  password = "1234"
  symbols = ".*"

  [users.trader]
  password = "secret"
  accounts = [ "A1" ]
  symbols = [ "BTC-.*" ]
  monitor_period_secs = 60
  ban_period_secs = 300
  request_limit = 10
Note
Update with your specific details.
You can search for YOUR_DERIBIT and change accordingly.
It is convenient to create flag file named deribit.flags
with the following content
--name=deribit
--metrics_listen_address=1234
--fix_uri=tcp://test.deribit.com:9881
--ws_uri=wss://test.deribit.com/ws/api/v2
--loop_sleep=0ns
--loop_timer_freq=250ns
Note
You can read more about flags and flag files here.
The gateway can now be started like this
roq-deribit \
  --config_file "deribit.toml" \
  --flagfile "deribit.flags" \
  --loop_cpu_affinity=1 \
  --client_listen_address ~/deribit.sock
Further readings
Client #1
Started like this
roq-cpp-samples-example-4 \
  --name "test" \
  --exchange "deribit" \
  --symbols ".*" \
  --dispatcher_affinity 4 \
  ~/deribit.sock
Client #2
Started like this
roq-test \
  --name "trader" \
  --exchange "deribit" \
  --symbol "BTC-PERPETUAL" \
  --dispatcher_affinity 5 \
  --enable_trading \
  ~/deribit.sock
Testing
Metrics
Gateway metrics can be retrieved from the HTTP interface
curl -s http://localhost:1234/metrics 2>&1 | less
For example, profiling information
# TYPE roq_profile histogram
roq_profile_bucket{source="deribit", connection="ws", function="parse", le="500"} 0
roq_profile_bucket{source="deribit", connection="ws", function="parse", le="1000"} 0
roq_profile_bucket{source="deribit", connection="ws", function="parse", le="2000"} 0
roq_profile_bucket{source="deribit", connection="ws", function="parse", le="5000"} 795
roq_profile_bucket{source="deribit", connection="ws", function="parse", le="10000"} 8471
roq_profile_bucket{source="deribit", connection="ws", function="parse", le="20000"} 8884
roq_profile_bucket{source="deribit", connection="ws", function="parse", le="+Inf"} 8895
roq_profile_sum{source="deribit", connection="ws", function="parse"} 6.13741e+07
roq_profile_count{source="deribit", connection="ws", function="parse"} 8895
This collection represents a histogram of all measurements since the gateway started. Each bucket has a total count for observations less-than or equal-to the number of nanoseconds, starting with 500 and ending with infinity. The sum is the total nanoseconds spent in the function. The count is the total number of times the function has been called.
Prometheus allows you to capture a time-series of these metrics and then compute incremental statistics.
For example, this would be the average processing time over a 1 minute rolling window
irate(roq_profile_sum[1m]) / on (source, connection, function)
irate(roq_profile_count[1m])
And this would be a conditional distribution, the percentage of events where processing time is larger than 5 microseconds
1 - irate(roq_profile_bucket{le="5000"}[1m]) / on (source, connection, function)
irate(roq_profile_count[1m])
Further readings
Function Profiling
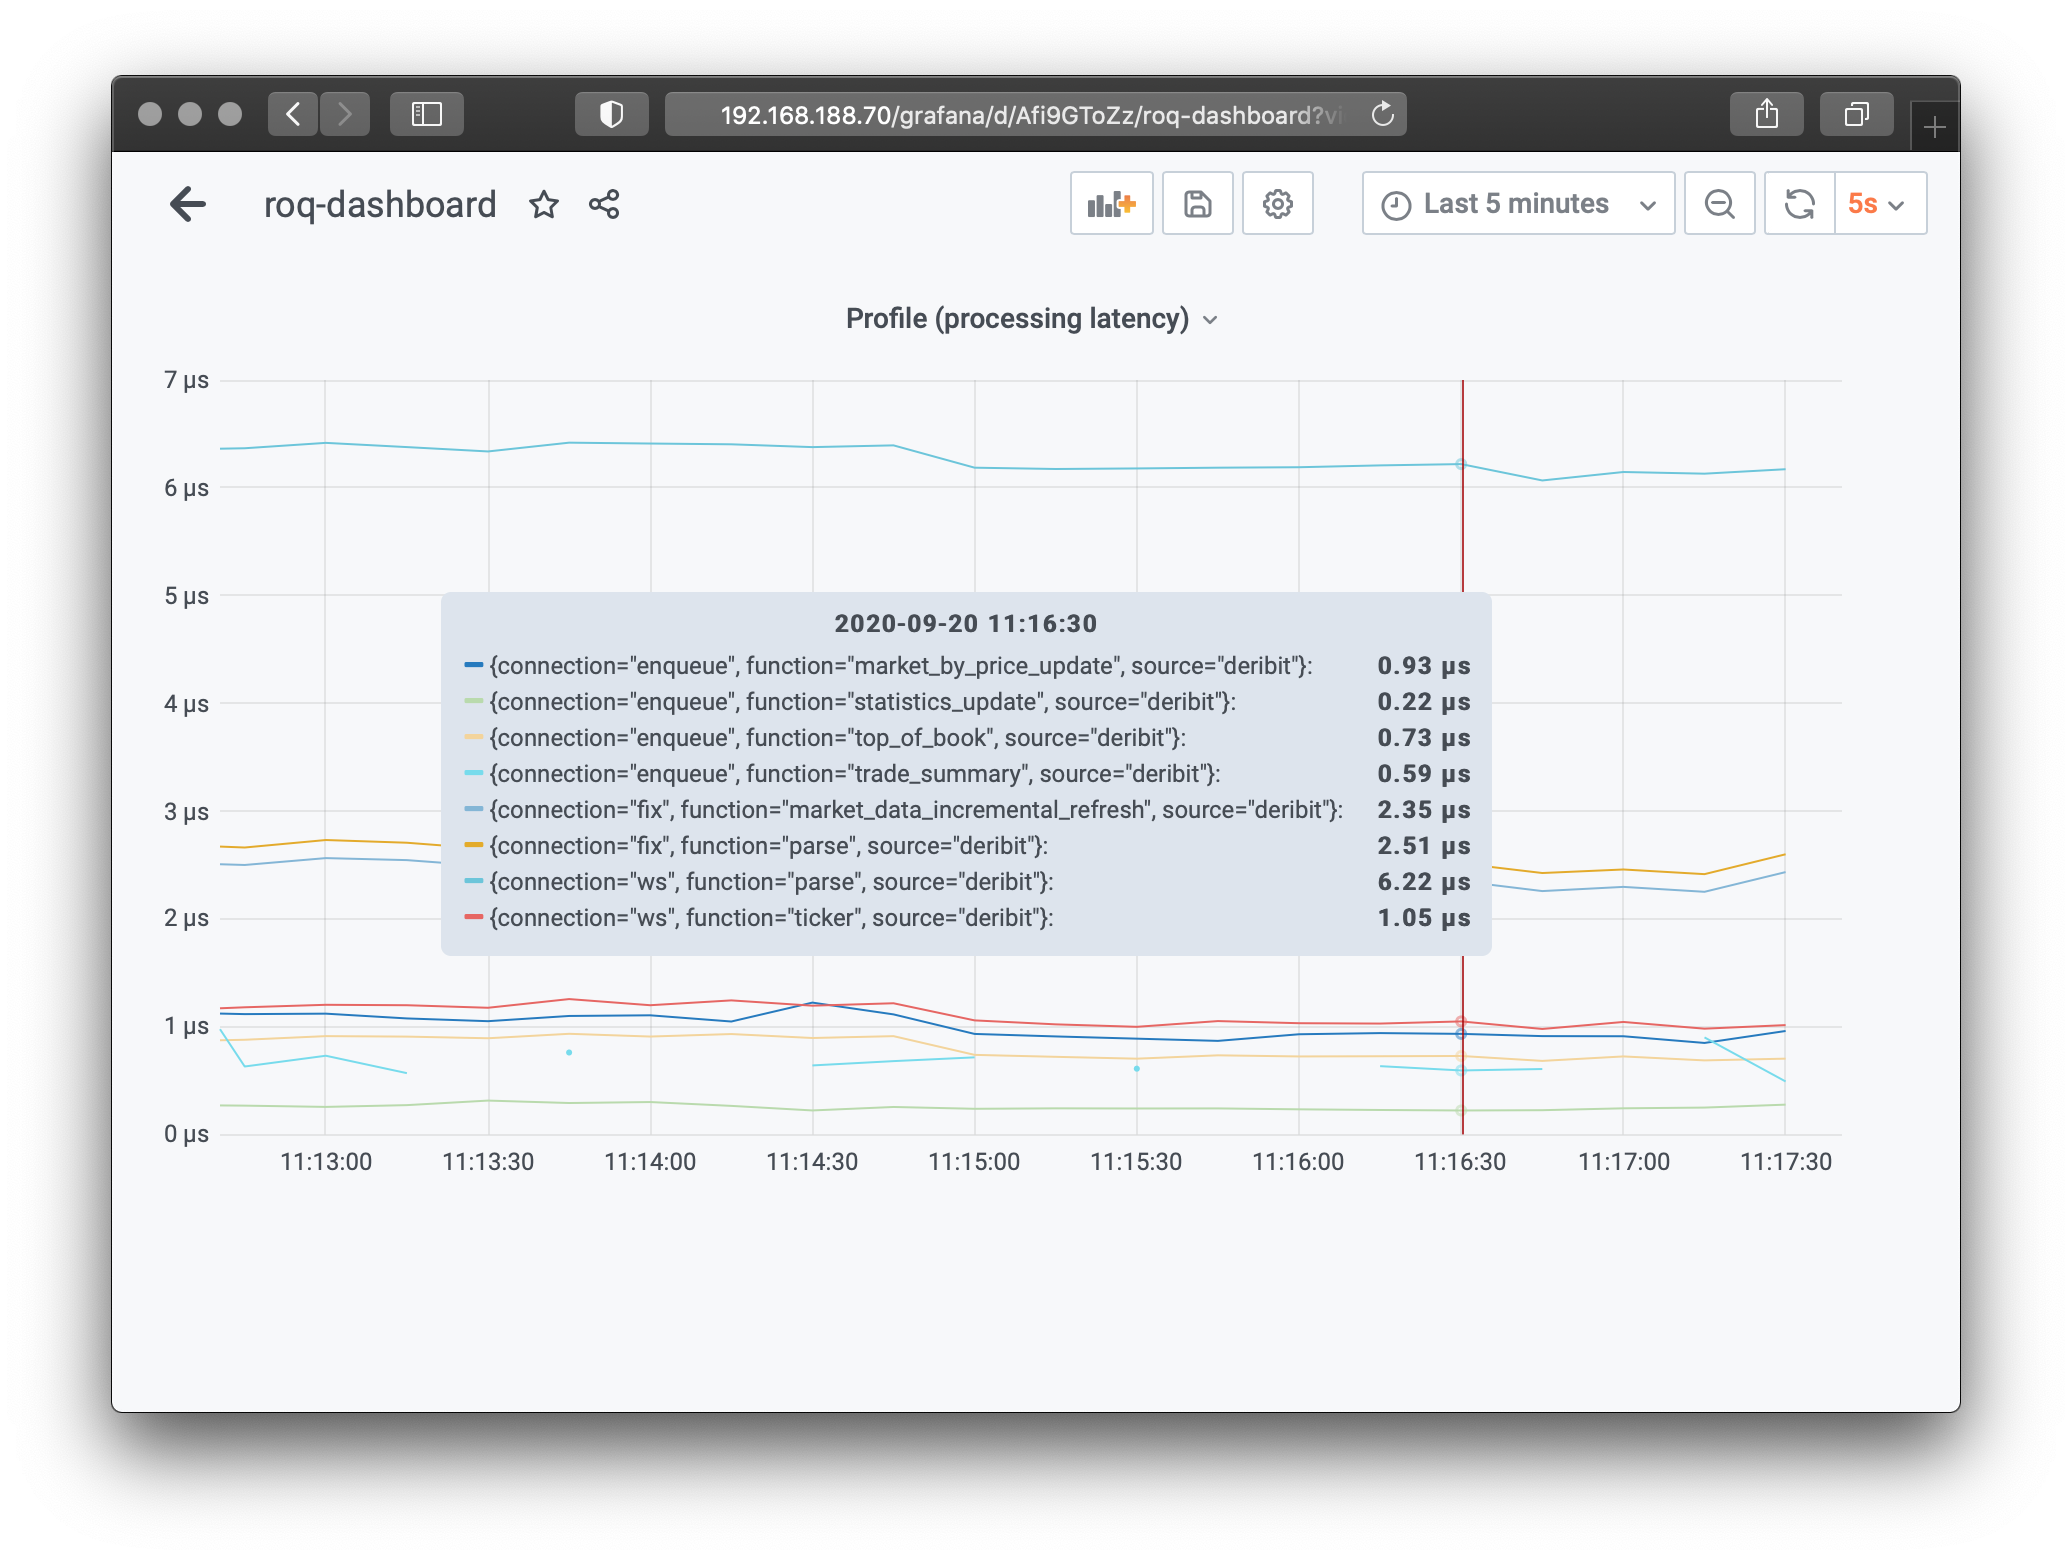
The following charts are lifted straight from Grafana using the Prometheus queries outlined in the previous section
First the average processing time at different measurement points
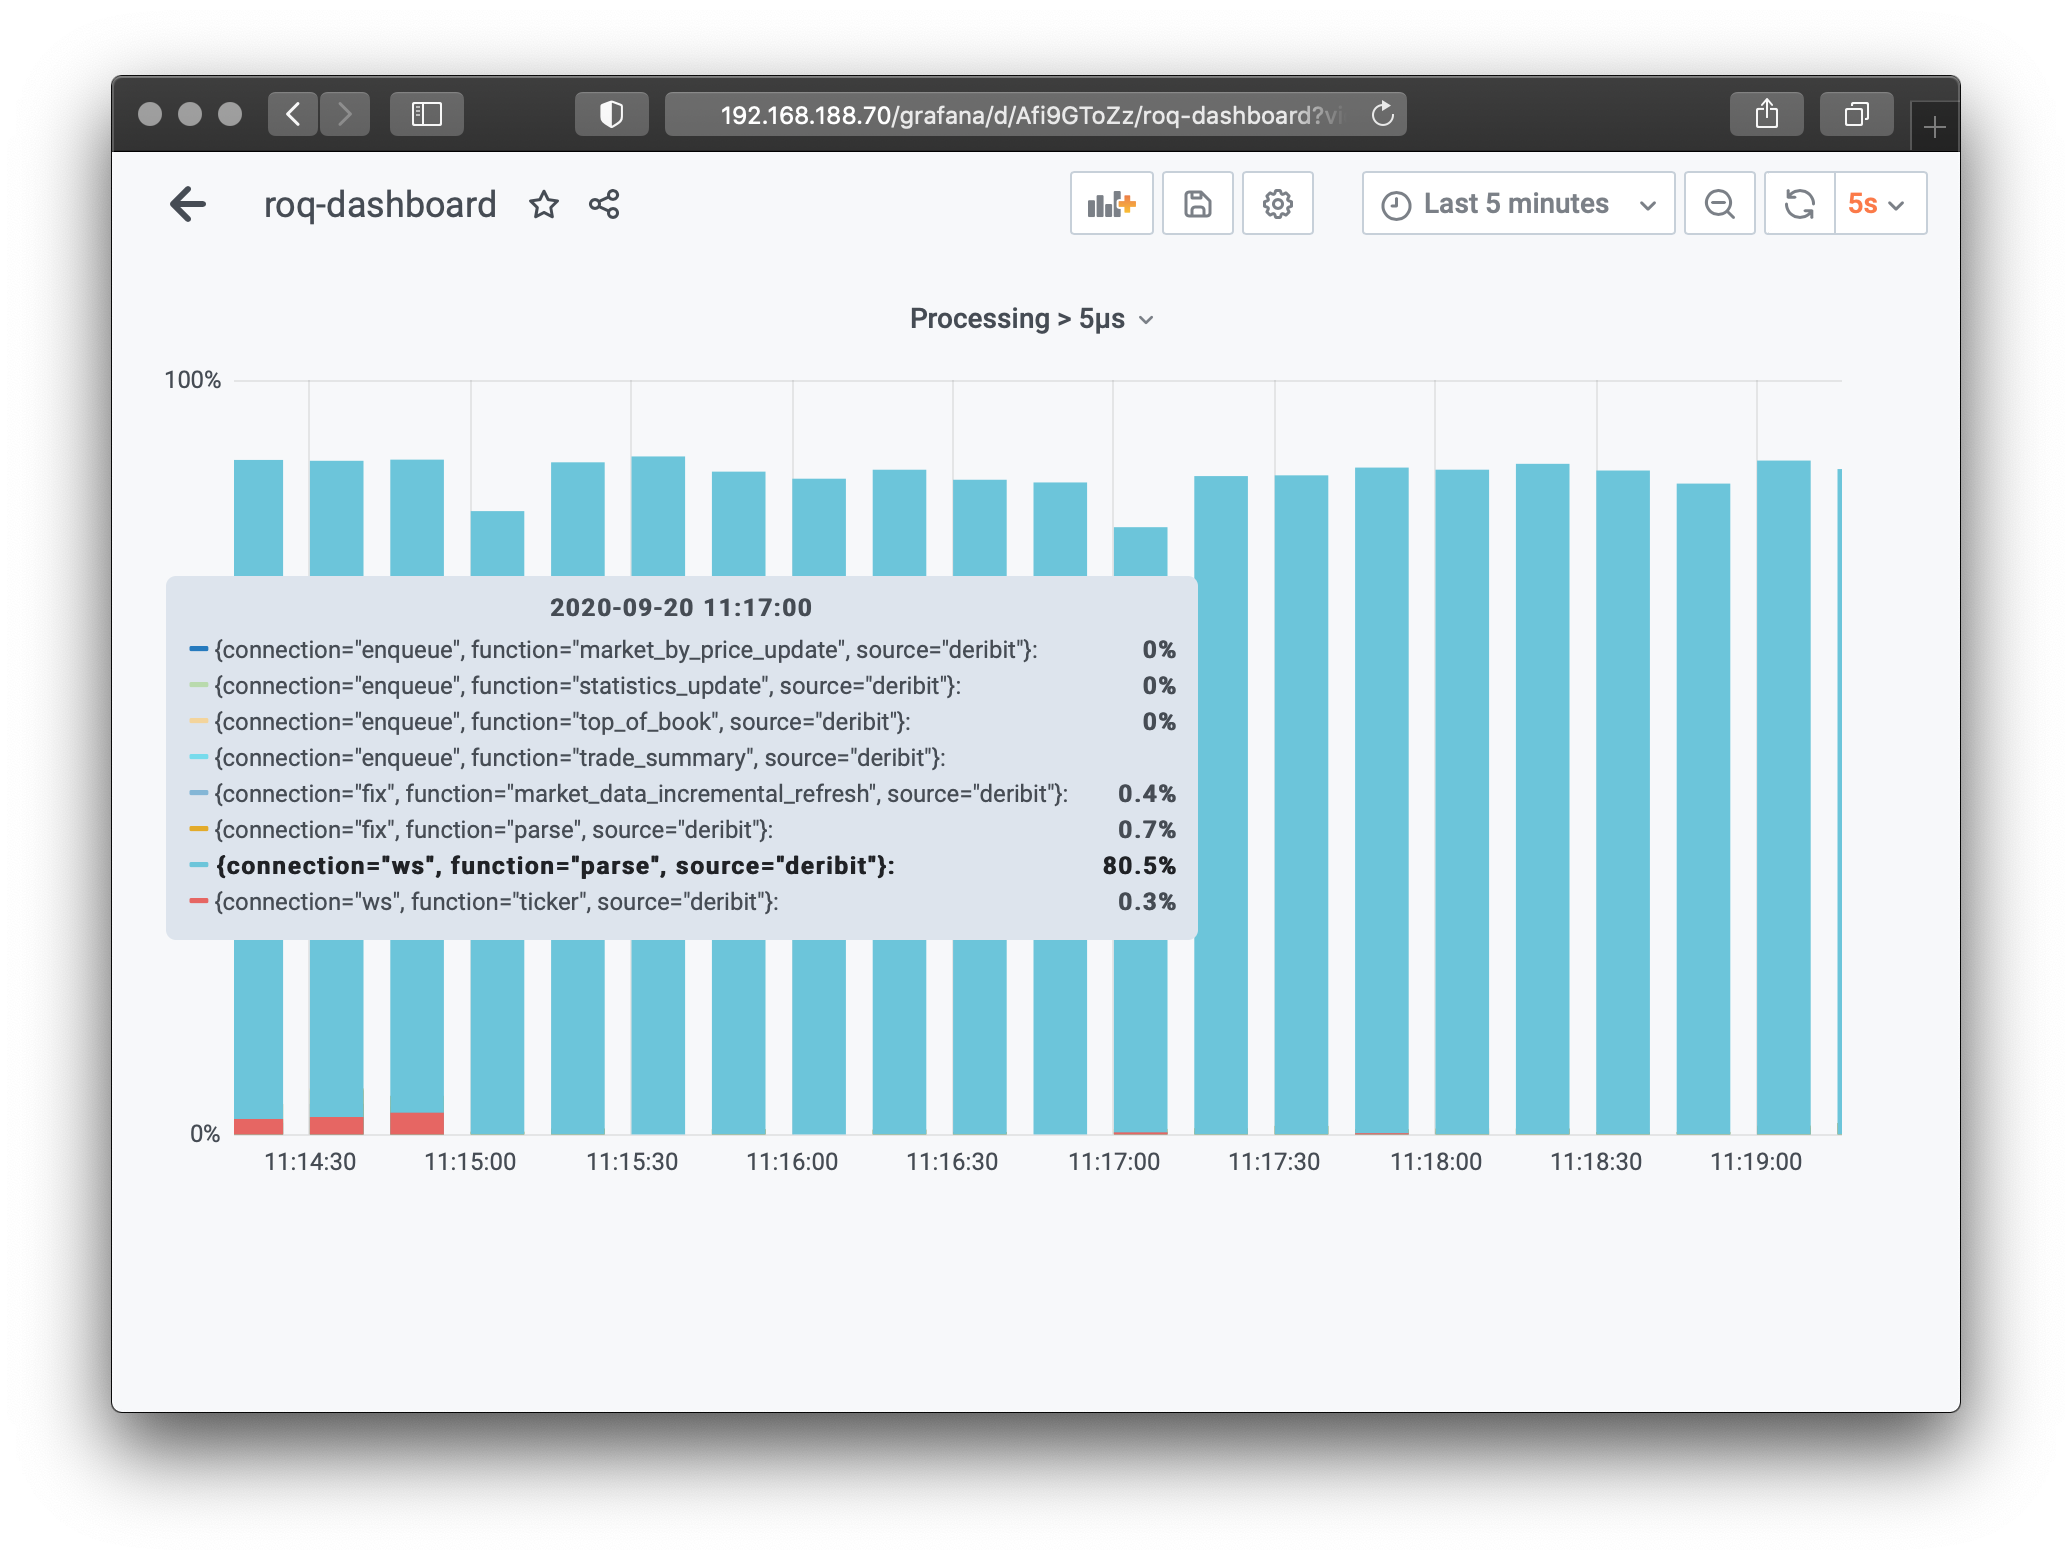
Then the conditional processing time
Internal Ping Latency
For this example we run two instances of Client #1.
The first instance (test) runs on processor #4 which is located
on the same NUMA node where the gateway is running.
The second instance (trader) runs on processor #3 which is on
a different NUMA node.
These are average 1-way heartbeat ping latencies between the gateway and the clients
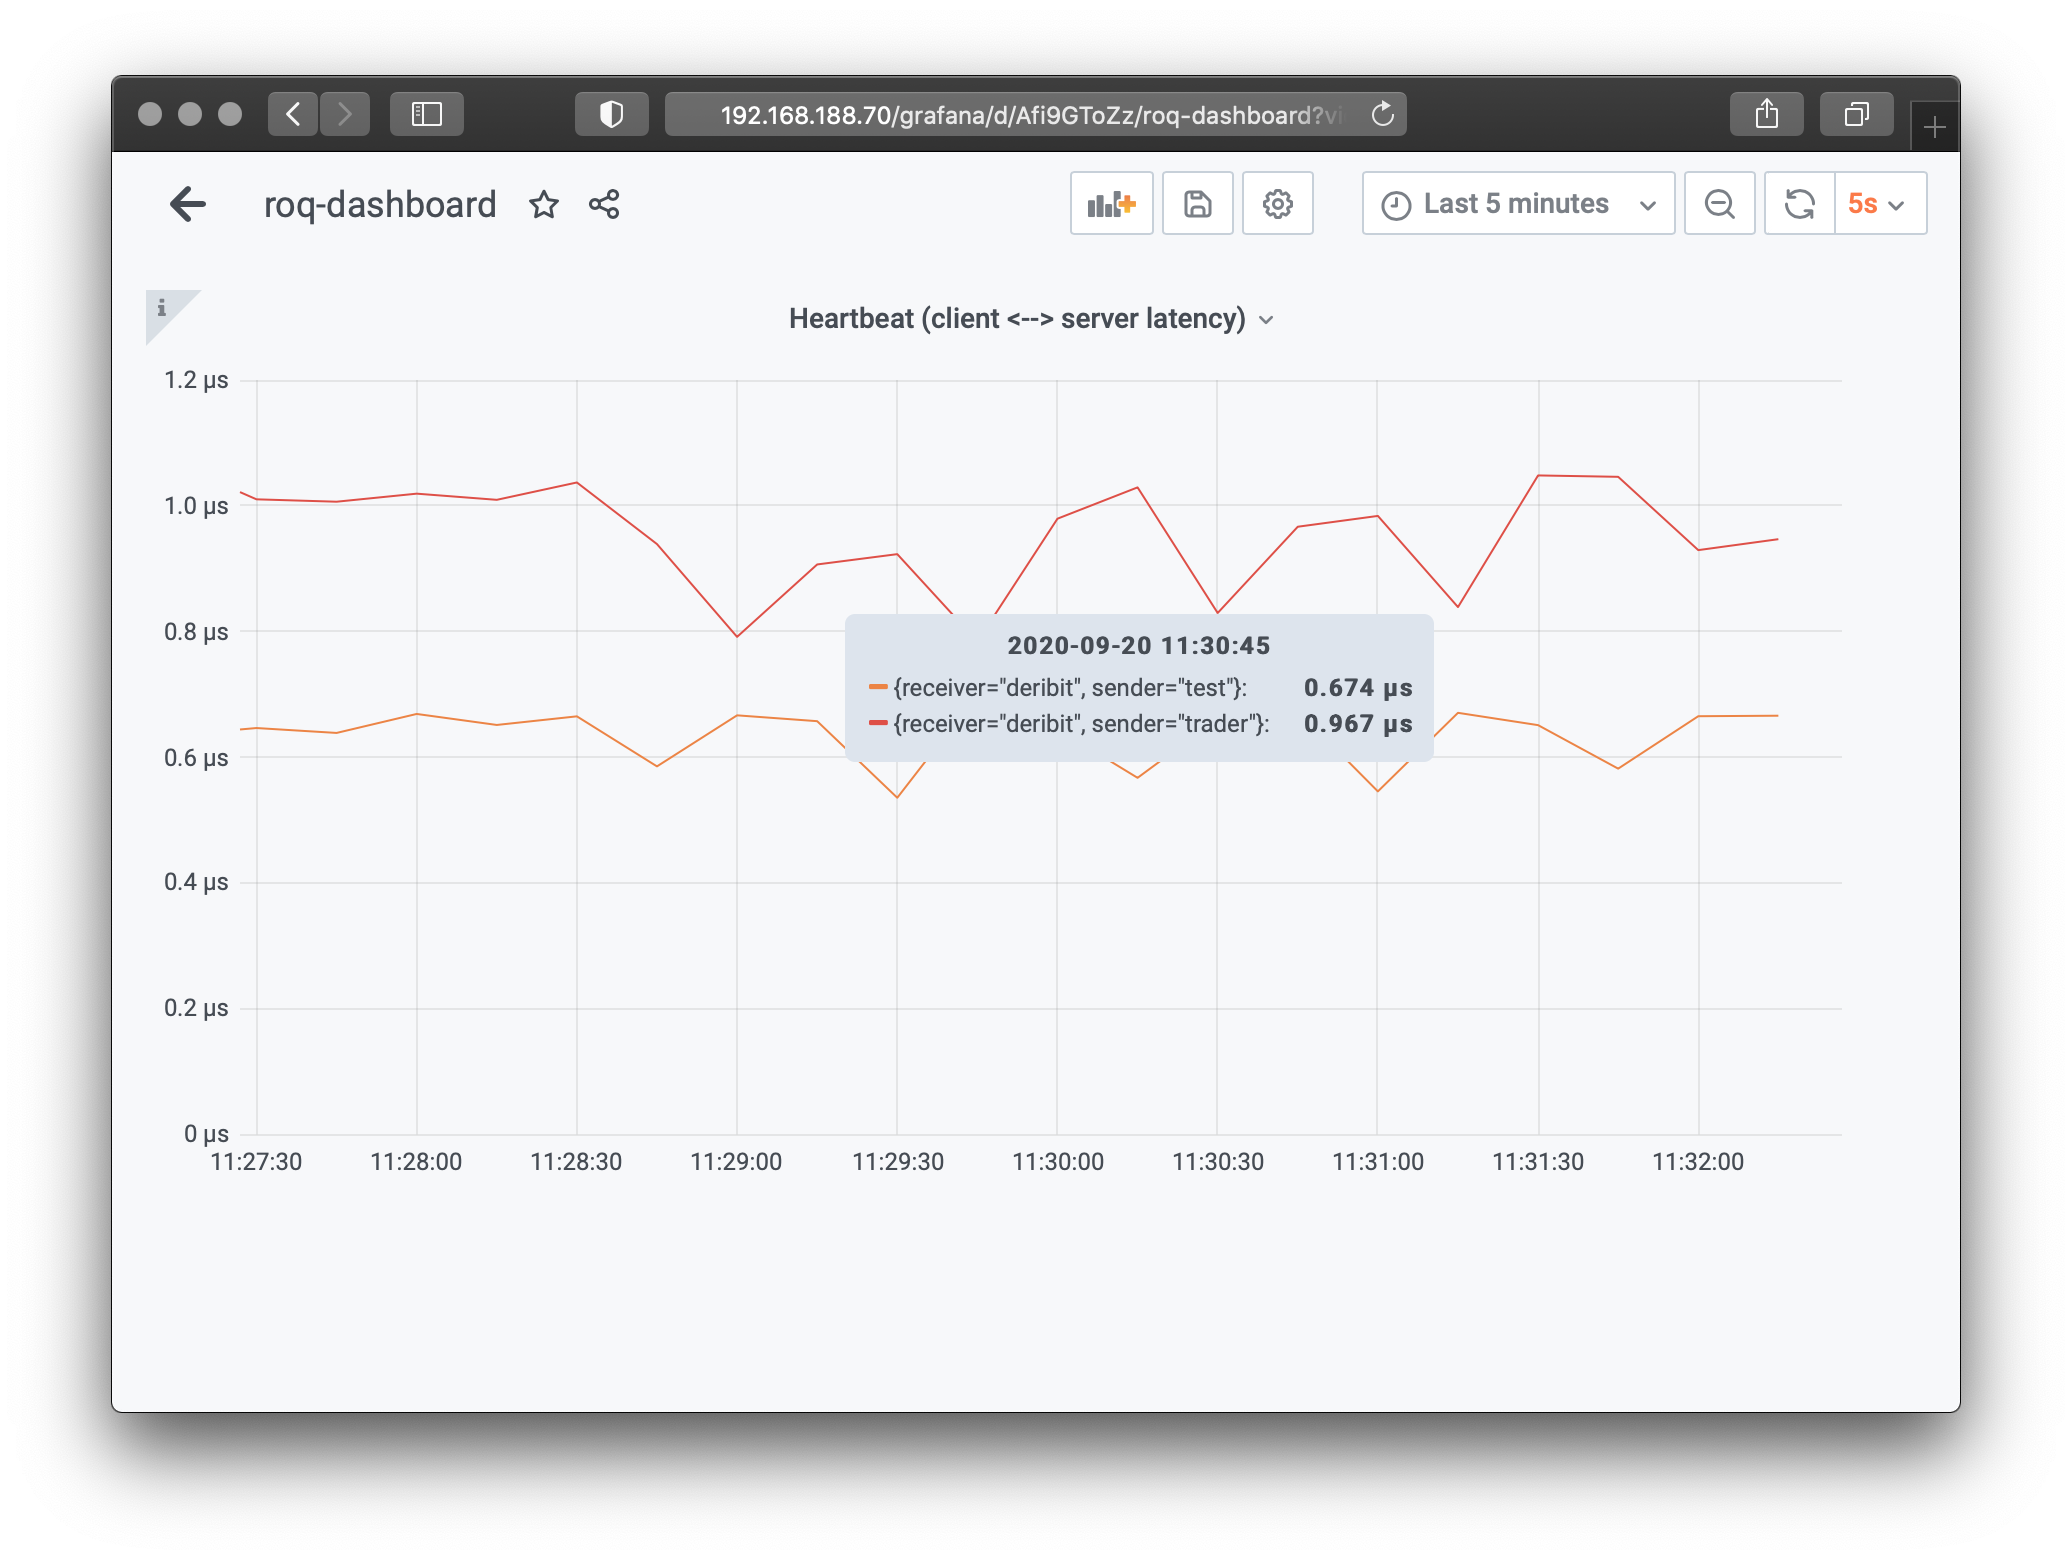
As expected, inter-process latencies are worse for the second instance.
Internal Round Trip Latency
The roq-test program is used to test order management.
It waits, creates an order, waits again, it cancels the order
and finally it terminates when the order is indeed cancelled.
I0920 09:39:43.255401 107190 application.cpp:55] ===== START =====
I0920 09:39:43.255441 107190 application.cpp:56] Process: name="roq-test", version="0.4.3", type="", git="", date="Sep 16 2020", time="06:02:37"
I0920 09:39:43.255546 107190 service.cpp:39] The metrics service will *not* be started
I0920 09:39:43.256109 107190 controller.cpp:108] Dispatching...
I0920 09:39:43.256121 107190 controller.cpp:112] Starting event loop thread...
I0920 09:39:43.256161 107190 controller.cpp:126] Thread affinity 5
I0920 09:39:43.256253 107191 controller.cpp:148] Event loop thread is now running
I0920 09:39:44.267789 107191 session_manager.cpp:44] Connecting "unix:///var/tmp/roq-deribit.sock"
I0920 09:39:44.273765 107191 session.cpp:38] Adding name="deribit" (user_id=5)
I0920 09:39:44.273853 107190 pollster.cpp:403] Adding name="deribit" (user_id=5)
I0920 09:39:44.273870 107190 strategy.cpp:132] Connected
I0920 09:39:44.273917 107190 strategy.cpp:140] Downloading market data ...
I0920 09:39:44.273921 107190 strategy.cpp:169] Market data is READY
I0920 09:39:44.274311 107190 strategy.cpp:150] download_end={account="", max_order_id=0}
I0920 09:39:44.274314 107190 strategy.cpp:154] Download market data has COMPLETED
I0920 09:39:44.274317 107190 strategy.cpp:143] Downloading account data ...
I0920 09:39:44.274322 107190 strategy.cpp:182] Order manager is READY
I0920 09:39:44.274325 107190 strategy.cpp:150] download_end={account="A1", max_order_id=1000}
I0920 09:39:44.274327 107190 strategy.cpp:157] Download account data has COMPLETED
I0920 09:39:44.274328 107190 strategy.cpp:274] *** INSTRUMENT READY ***
I0920 09:39:44.395049 107190 strategy.cpp:261] *** READY TO TRADE ***
I0920 09:39:44.395222 107190 strategy.cpp:56] create_order={account="A1", order_id=1001, exchange="deribit", symbol="BTC-PERPETUAL", side=BUY, quantity=1.0, order_type=LIMIT, price=10959.5, time_in_force=GTC, position_effect=UNDEFINED, execution_instruction=UNDEFINED, stop_price=nan, max_show_quantity=nan, order_template=""}
I0920 09:39:44.395259 107190 strategy.cpp:225] order_ack={account="A1", order_id=1001, type=CREATE_ORDER, origin=GATEWAY, status=FORWARDED, error=UNDEFINED, text="", gateway_order_id=10000001, external_order_id="", request_id="roq-1600592255-15"}
I0920 09:39:44.425197 107190 strategy.cpp:225] order_ack={account="A1", order_id=1001, type=CREATE_ORDER, origin=EXCHANGE, status=ACCEPTED, error=UNDEFINED, text="success", gateway_order_id=10000001, external_order_id="4504419316", request_id="roq-1600592255-15"}
I0920 09:39:44.425207 107190 strategy.cpp:233] order_update={account="A1", order_id=1001, exchange="deribit", symbol="BTC-PERPETUAL", status=WORKING, side=BUY, price=10959.5, remaining_quantity=1.0, traded_quantity=0.0, position_effect=UNDEFINED, order_template="", create_time_utc=1600594784439000000ns, update_time_utc=1600594784439000000ns, gateway_order_id=10000001, external_order_id="4504419316"}
I0920 09:40:14.425761 107190 strategy.cpp:89] cancel_order={account="A1", order_id=1001}
I0920 09:40:14.425814 107190 strategy.cpp:225] order_ack={account="A1", order_id=1001, type=CANCEL_ORDER, origin=GATEWAY, status=FORWARDED, error=UNDEFINED, text="", gateway_order_id=10000001, external_order_id="4504419316", request_id="roq-1600592255-16"}
I0920 09:40:14.447198 107190 strategy.cpp:225] order_ack={account="A1", order_id=1001, type=CANCEL_ORDER, origin=EXCHANGE, status=ACCEPTED, error=UNDEFINED, text="canceled", gateway_order_id=10000001, external_order_id="4504419316", request_id="roq-1600592255-16"}
I0920 09:40:14.447211 107190 strategy.cpp:233] order_update={account="A1", order_id=1001, exchange="deribit", symbol="BTC-PERPETUAL", status=CANCELED, side=BUY, price=10959.5, remaining_quantity=1.0, traded_quantity=0.0, position_effect=UNDEFINED, order_template="", create_time_utc=1600594784439000000ns, update_time_utc=1600594784439000000ns, gateway_order_id=10000001, external_order_id="4504419316"}
I0920 09:40:14.447216 107190 strategy.cpp:104] *** FINISHED ***
W0920 09:40:14.447790 107191 controller.cpp:162] Signal 15 (Terminated)
I0920 09:40:14.447805 107191 controller.cpp:158] Event loop thread has terminated
I0920 09:40:14.447805 107190 controller.cpp:118] Waiting for event loop thread to terminate...
I0920 09:40:14.447855 107190 controller.cpp:121] Done!
I0920 09:40:14.448083 107190 application.cpp:69] ===== STOP =====
The gateway updates round-trip latencies for each request
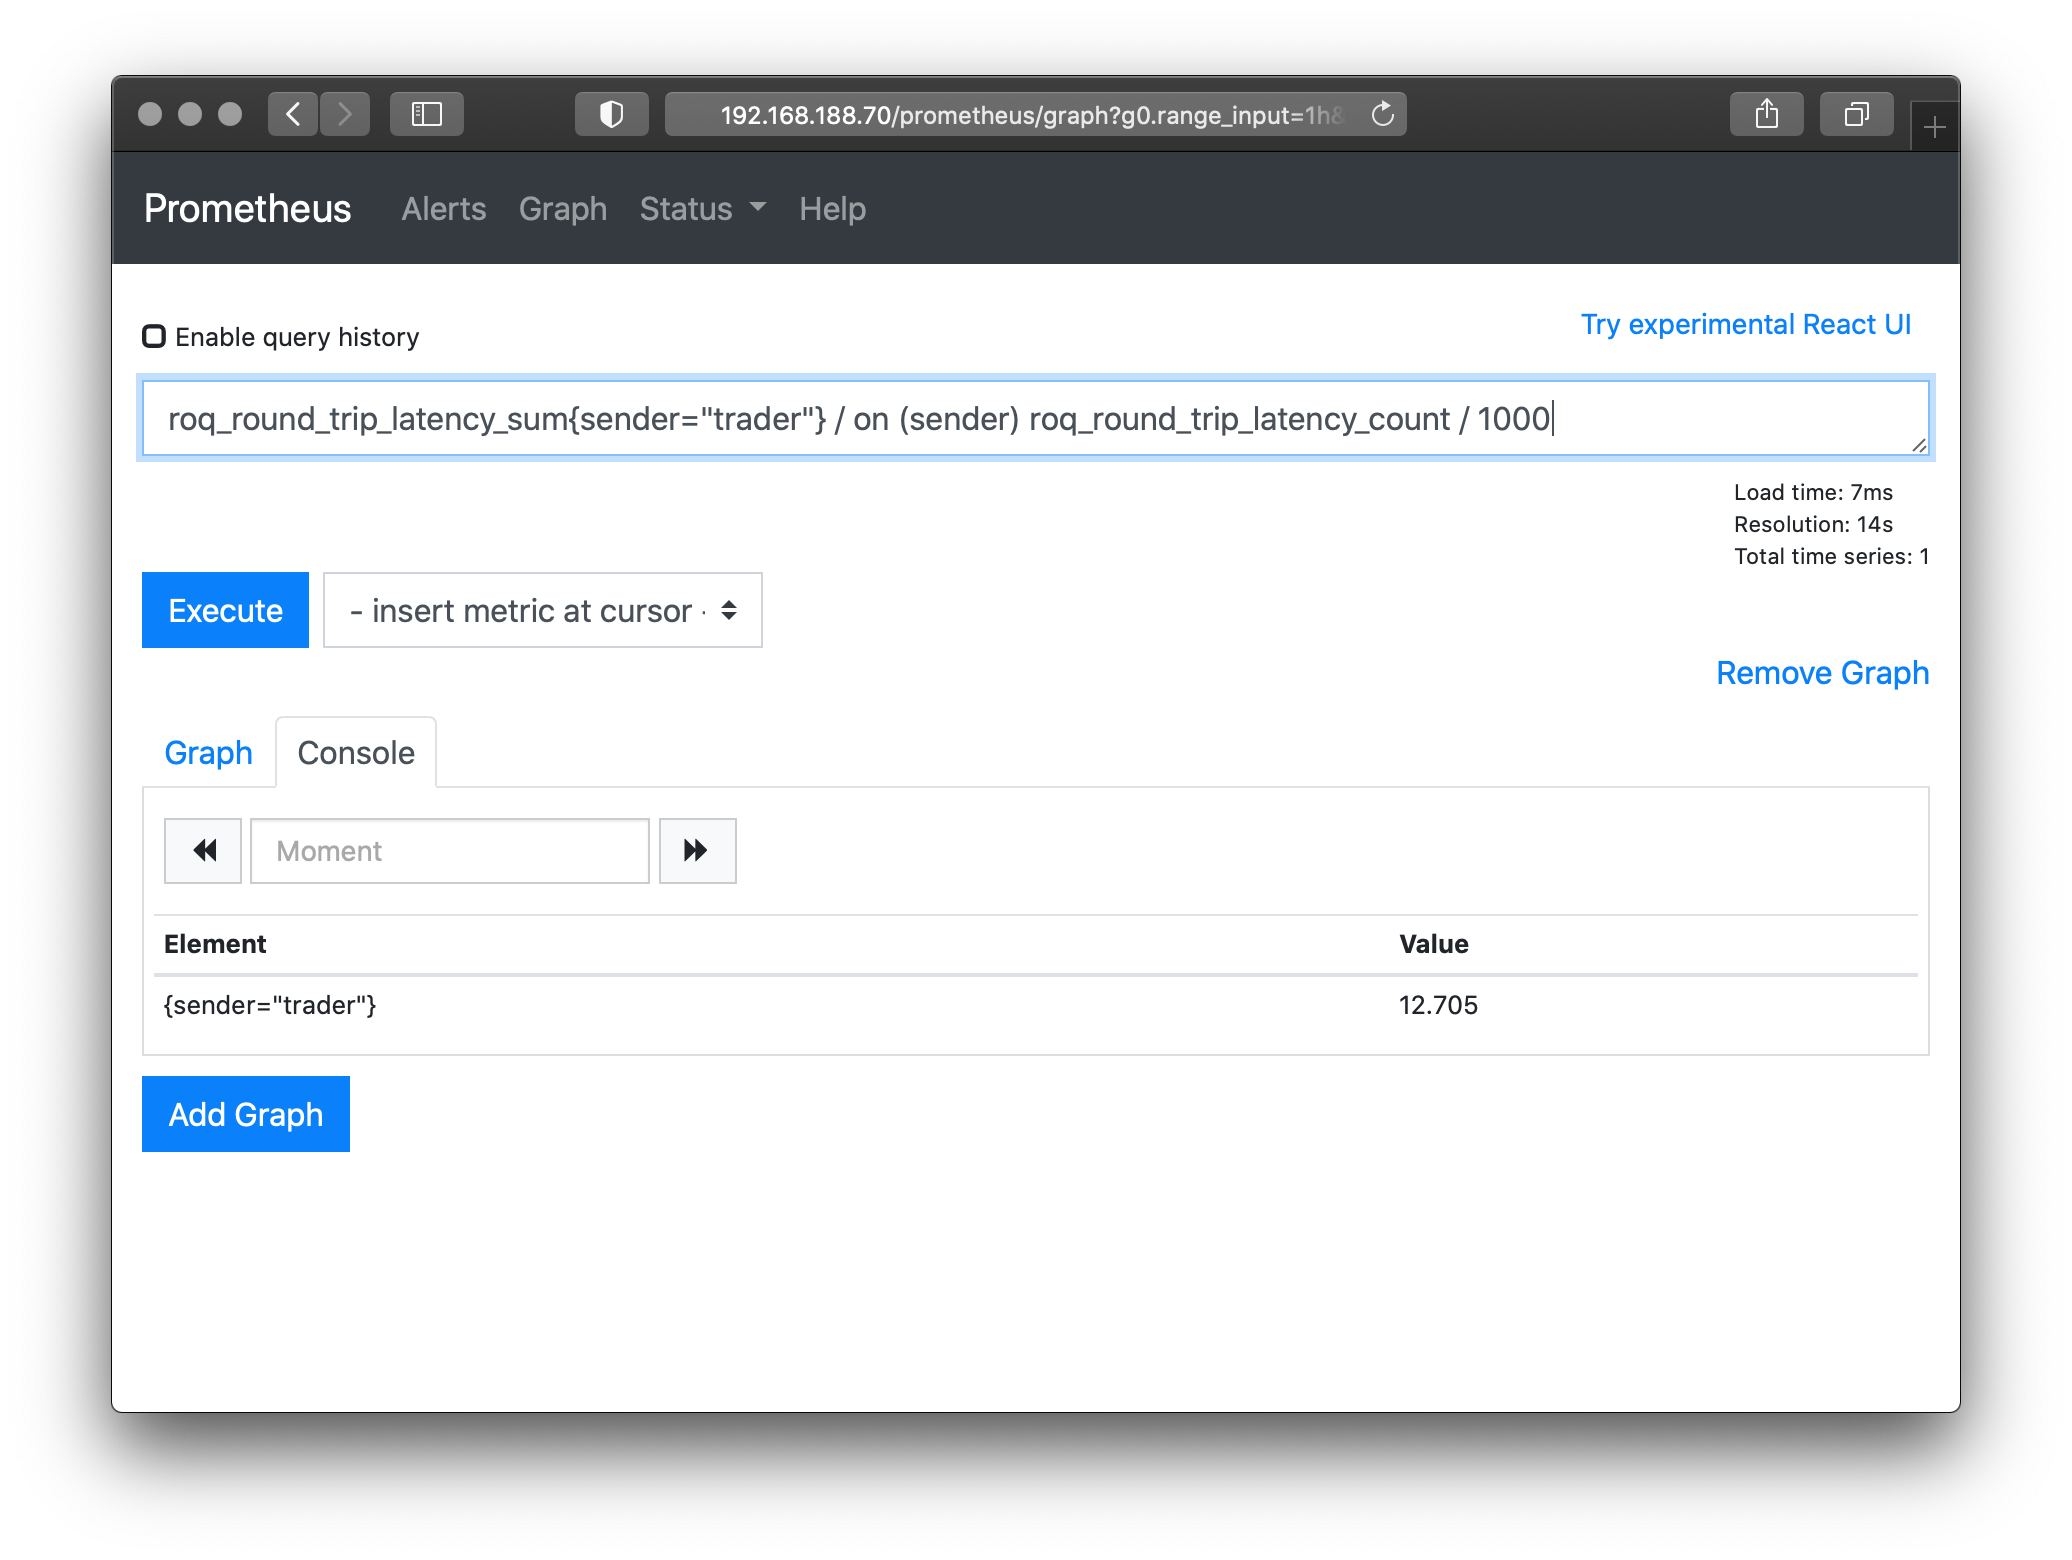
For this particular setup we have an average round-trip latency around 12 microseconds.
External Ping Latency
The gateway also sends regular ping messages to the exchange
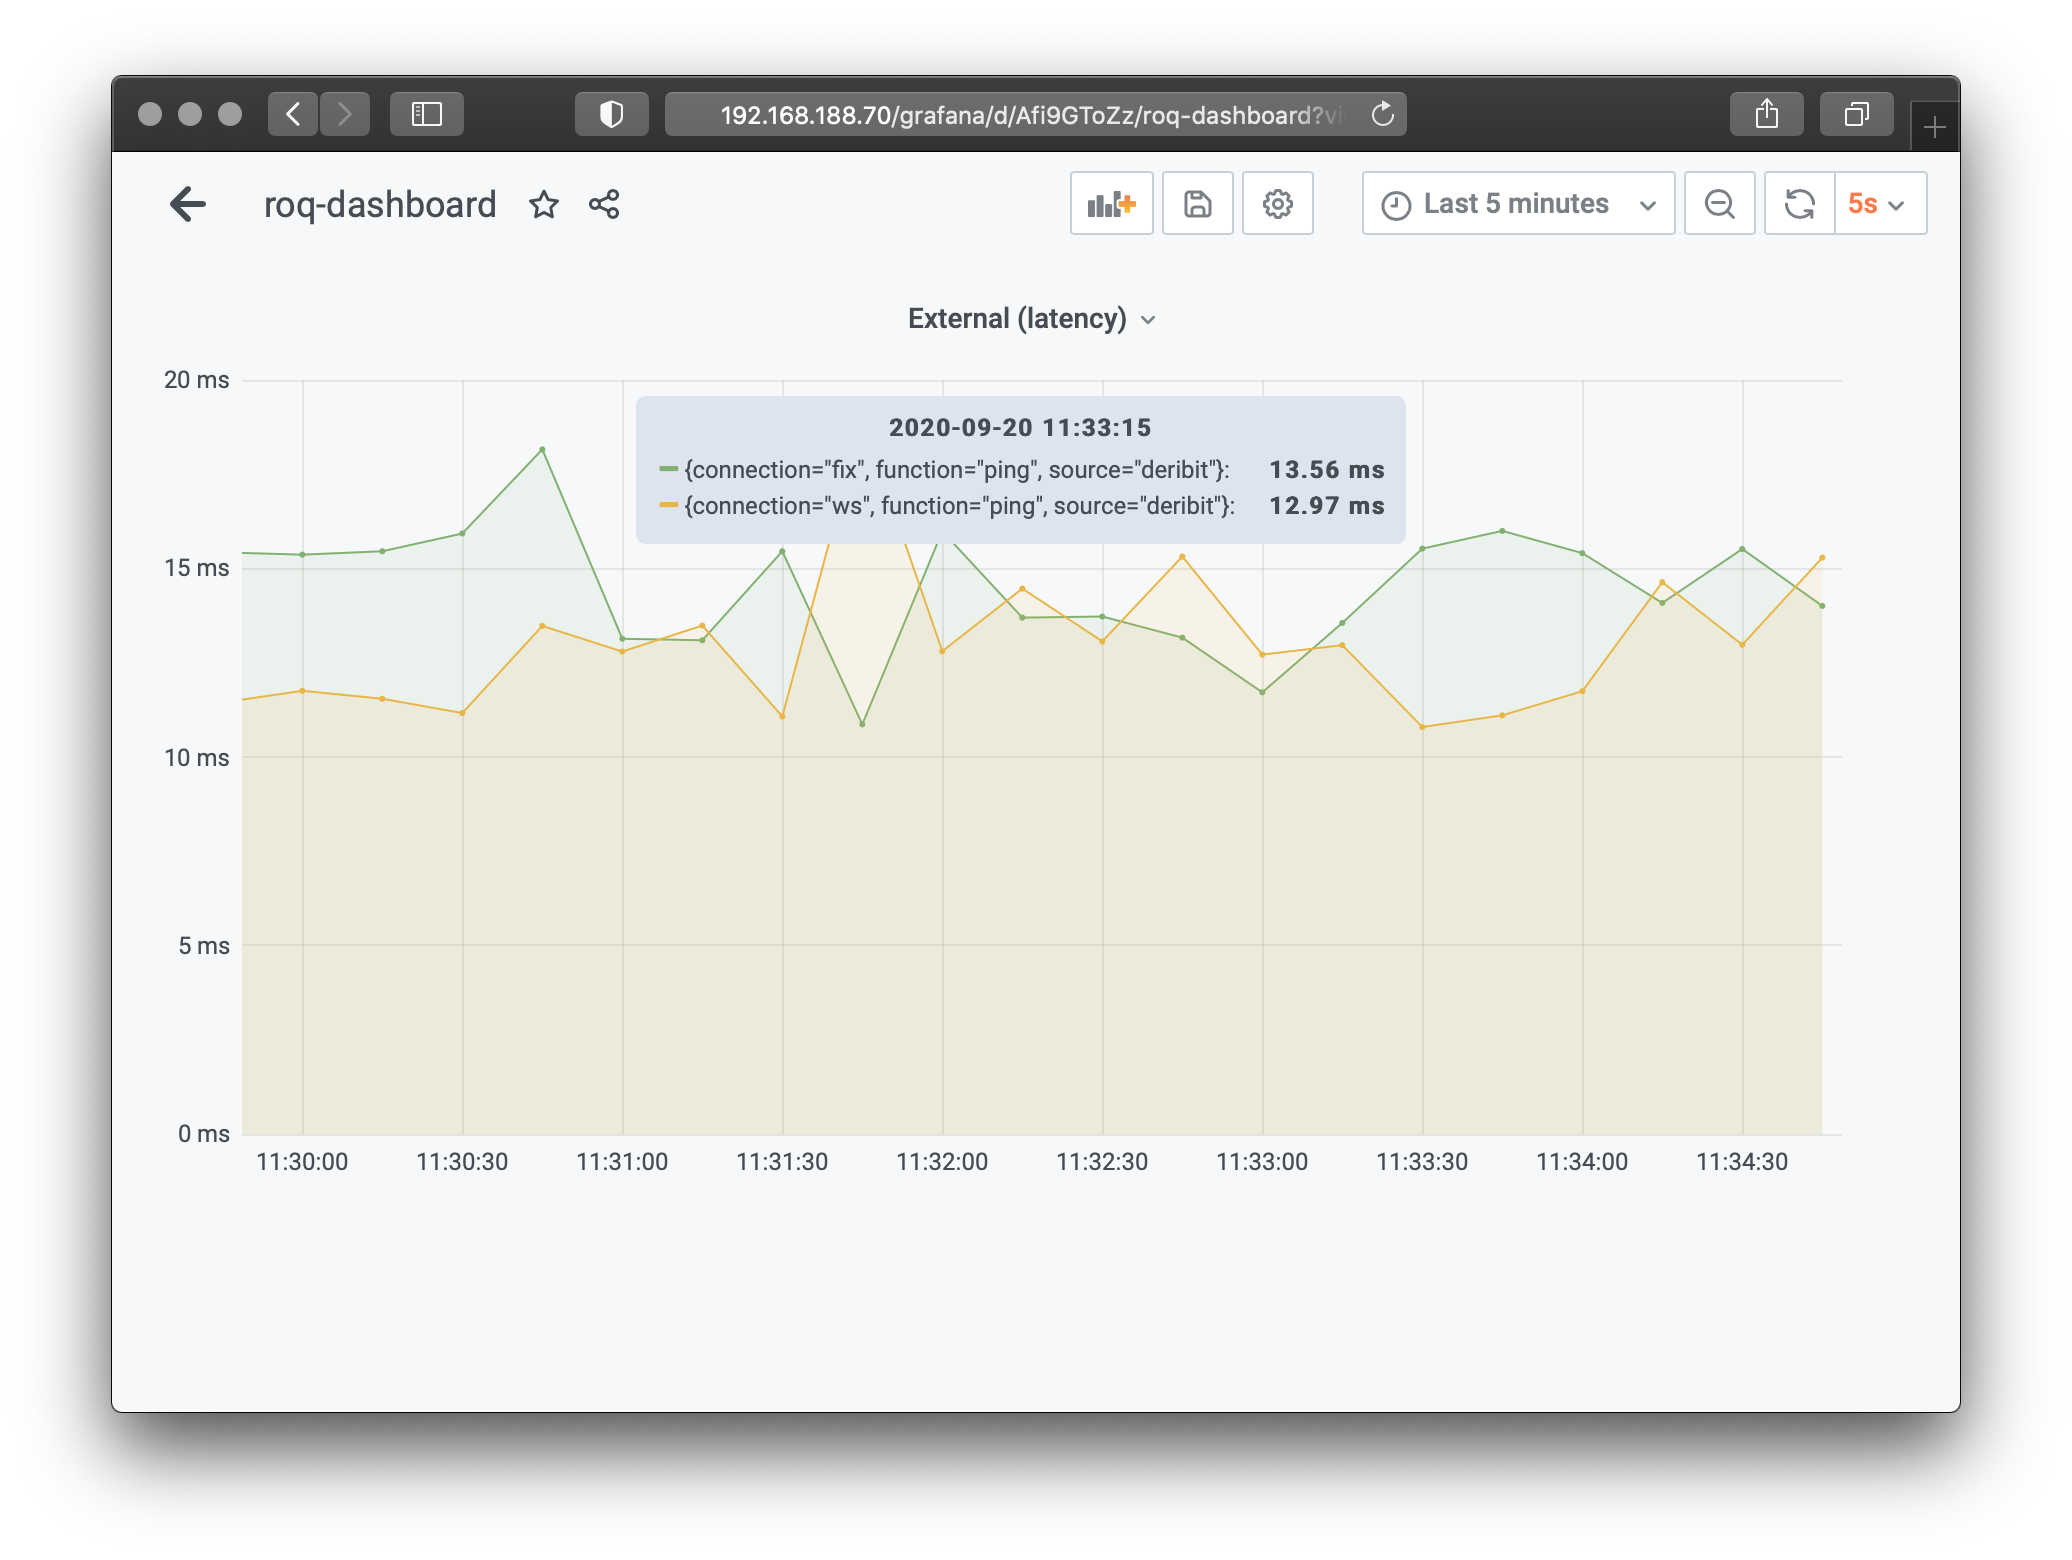
The main point of showing the external latency is that the software itself should be fast enough for most purposes.
In this particular case there’s in decreasing order of magnitude
Physical distance between server (Switzerland) and exchange (London)
Variability when the network packets meant for you are routed by a standard ISP
Standard network switch equipment
Standard Linux network stack (i.e. no kernel-bypass solution)
External factors will most likely dominate the total latency.
However, you may possibly benefit from low latency, if you have the option to co-locate with the exchange.
Another take on this is that you have one less thing to worry about, if you can rely on the software solution to be performant enough.
Conclusion
We have shown how to configure a server, install and configure the software, and how to obtain relevant metrics for host latencies. Examples have been shown using command-line, Prometheus and Grafana.
To note, this test used an AMD Epyc Zen (1st generation) embedded processor. With a proper server solution you should easily be able to get single digit microsecond host round-trip latencies.
If you have any comments, feel free to share or contact us using the links below.