Configure Prometheus (metrics and monitoring)
You will learn basic Prometheus configuration and how to query the collected metrics.
Configuration
Classic
A minimal Prometheus config file could look like this
global:
  scrape_interval: 2s

  scrape_configs:
    - job_name: deribit
      metrics_path: '/metrics'
      static_configs:
        - targets: ['localhost:1234']
Prometheus will pull metrics from the list of services under scrape_configs.
In this case we have launched the gateway with the --service_listen_address=tcp://localhost:1234 flag.
Pushgateway
You can also choose to push metrics to Prometheus if you also launch Prometheus’ pushgateway.
There’s no special configuration needed for the pushgateway.
However, Prometheus should be configured to scrape the pushgateway instead of the individual services
global:
  scrape_interval: 2s

  scrape_configs:
    - job_name: pushgateway
      metrics_path: '/metrics'
      static_configs:
        - targets: ['pushgateway.service:9091']
In this case we launch the gateway with the --metrics_push_uri=http://localhost:9091/metrics flag.
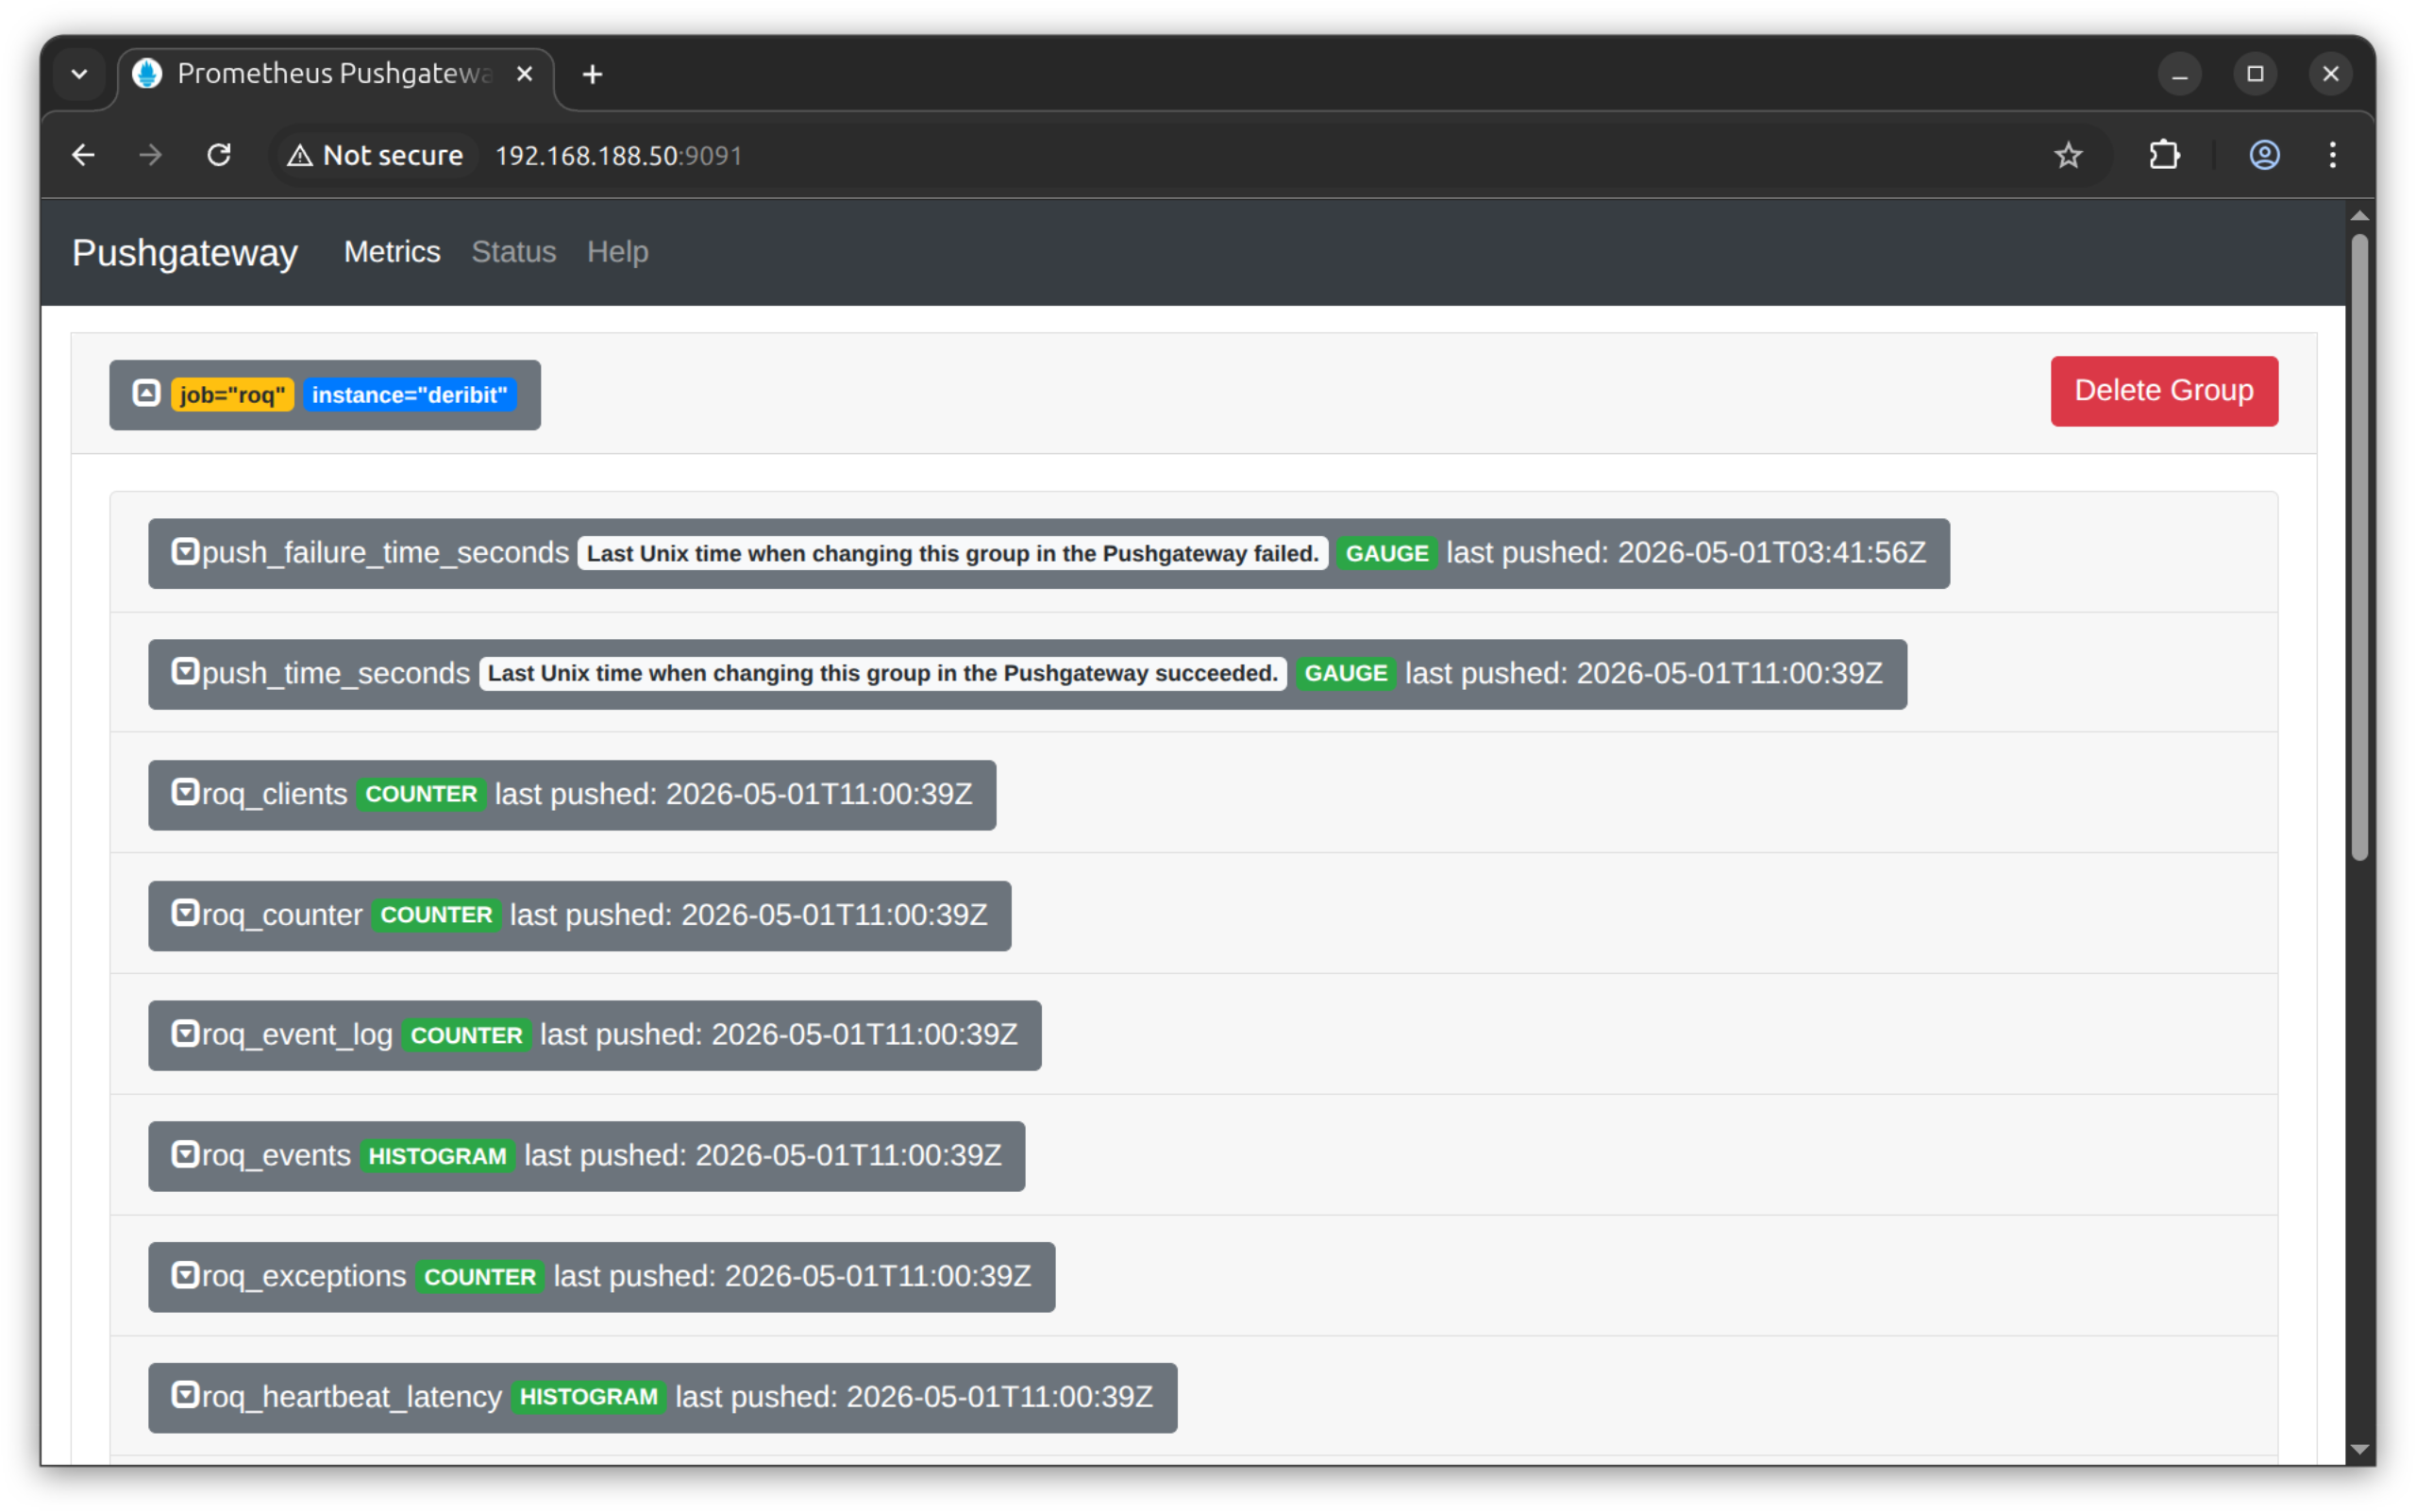
You should be able to see your metrics using the pushgateway’s UI
Prometheus
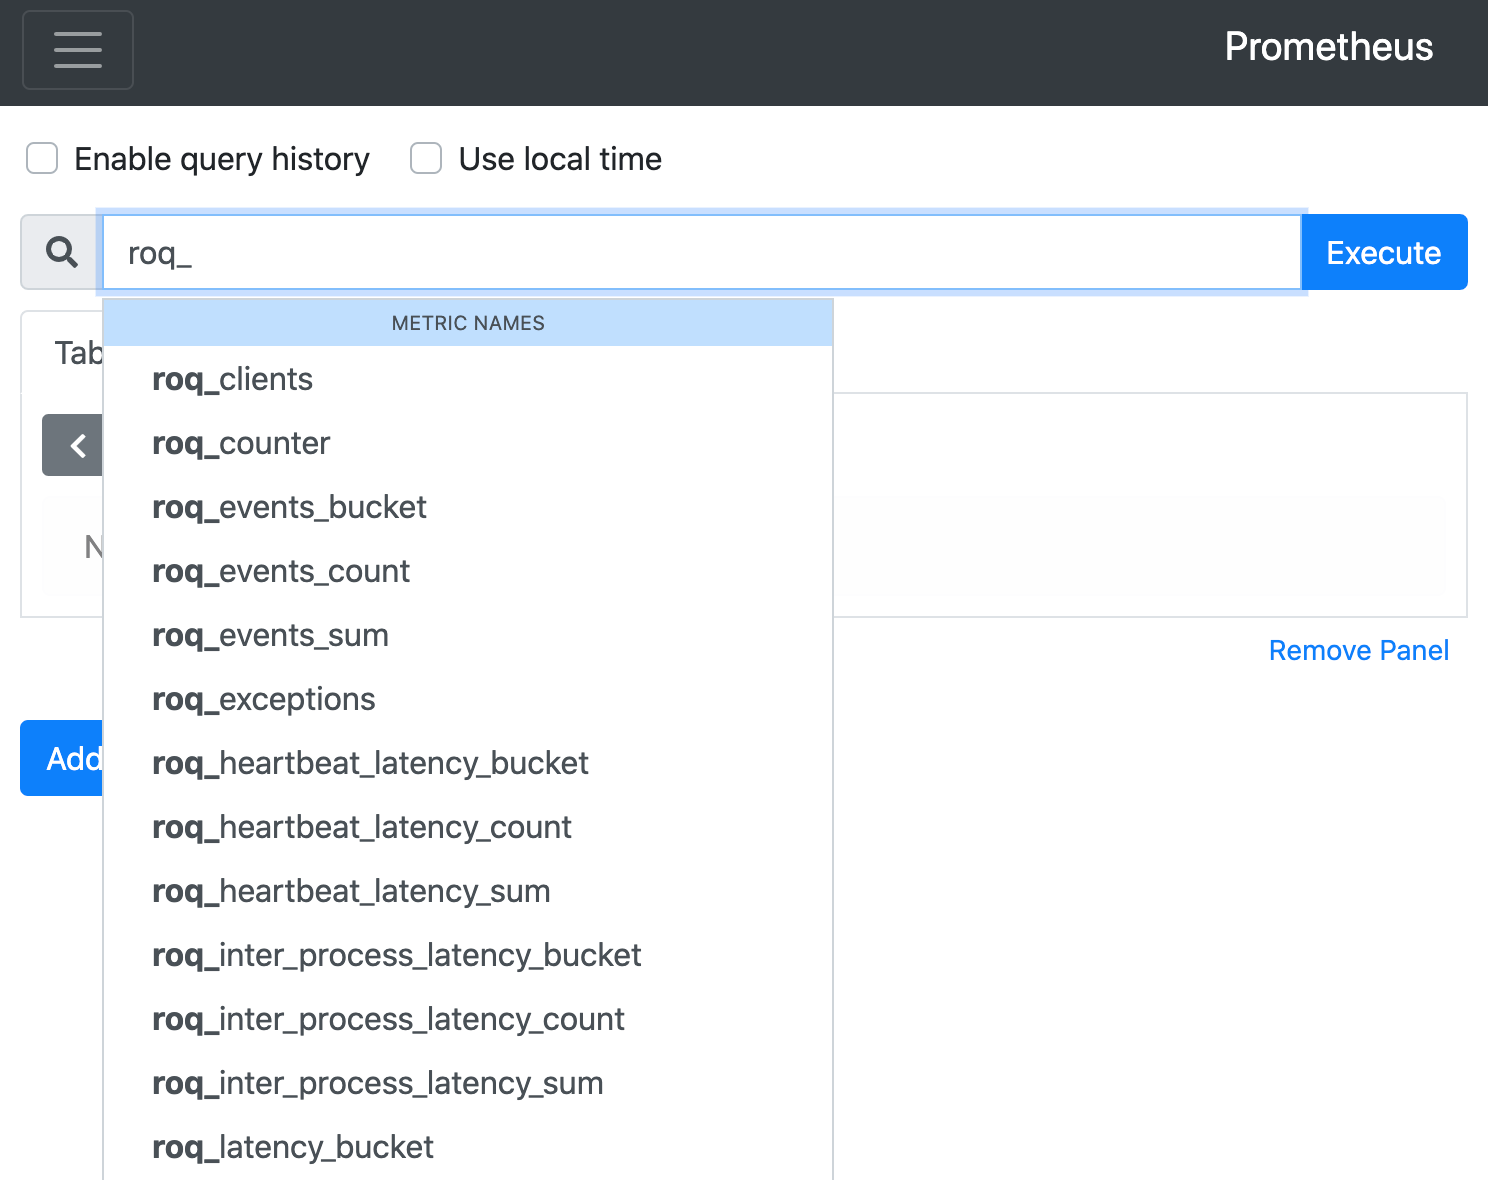
Prometheus’ UI let’s you easily search for metrics
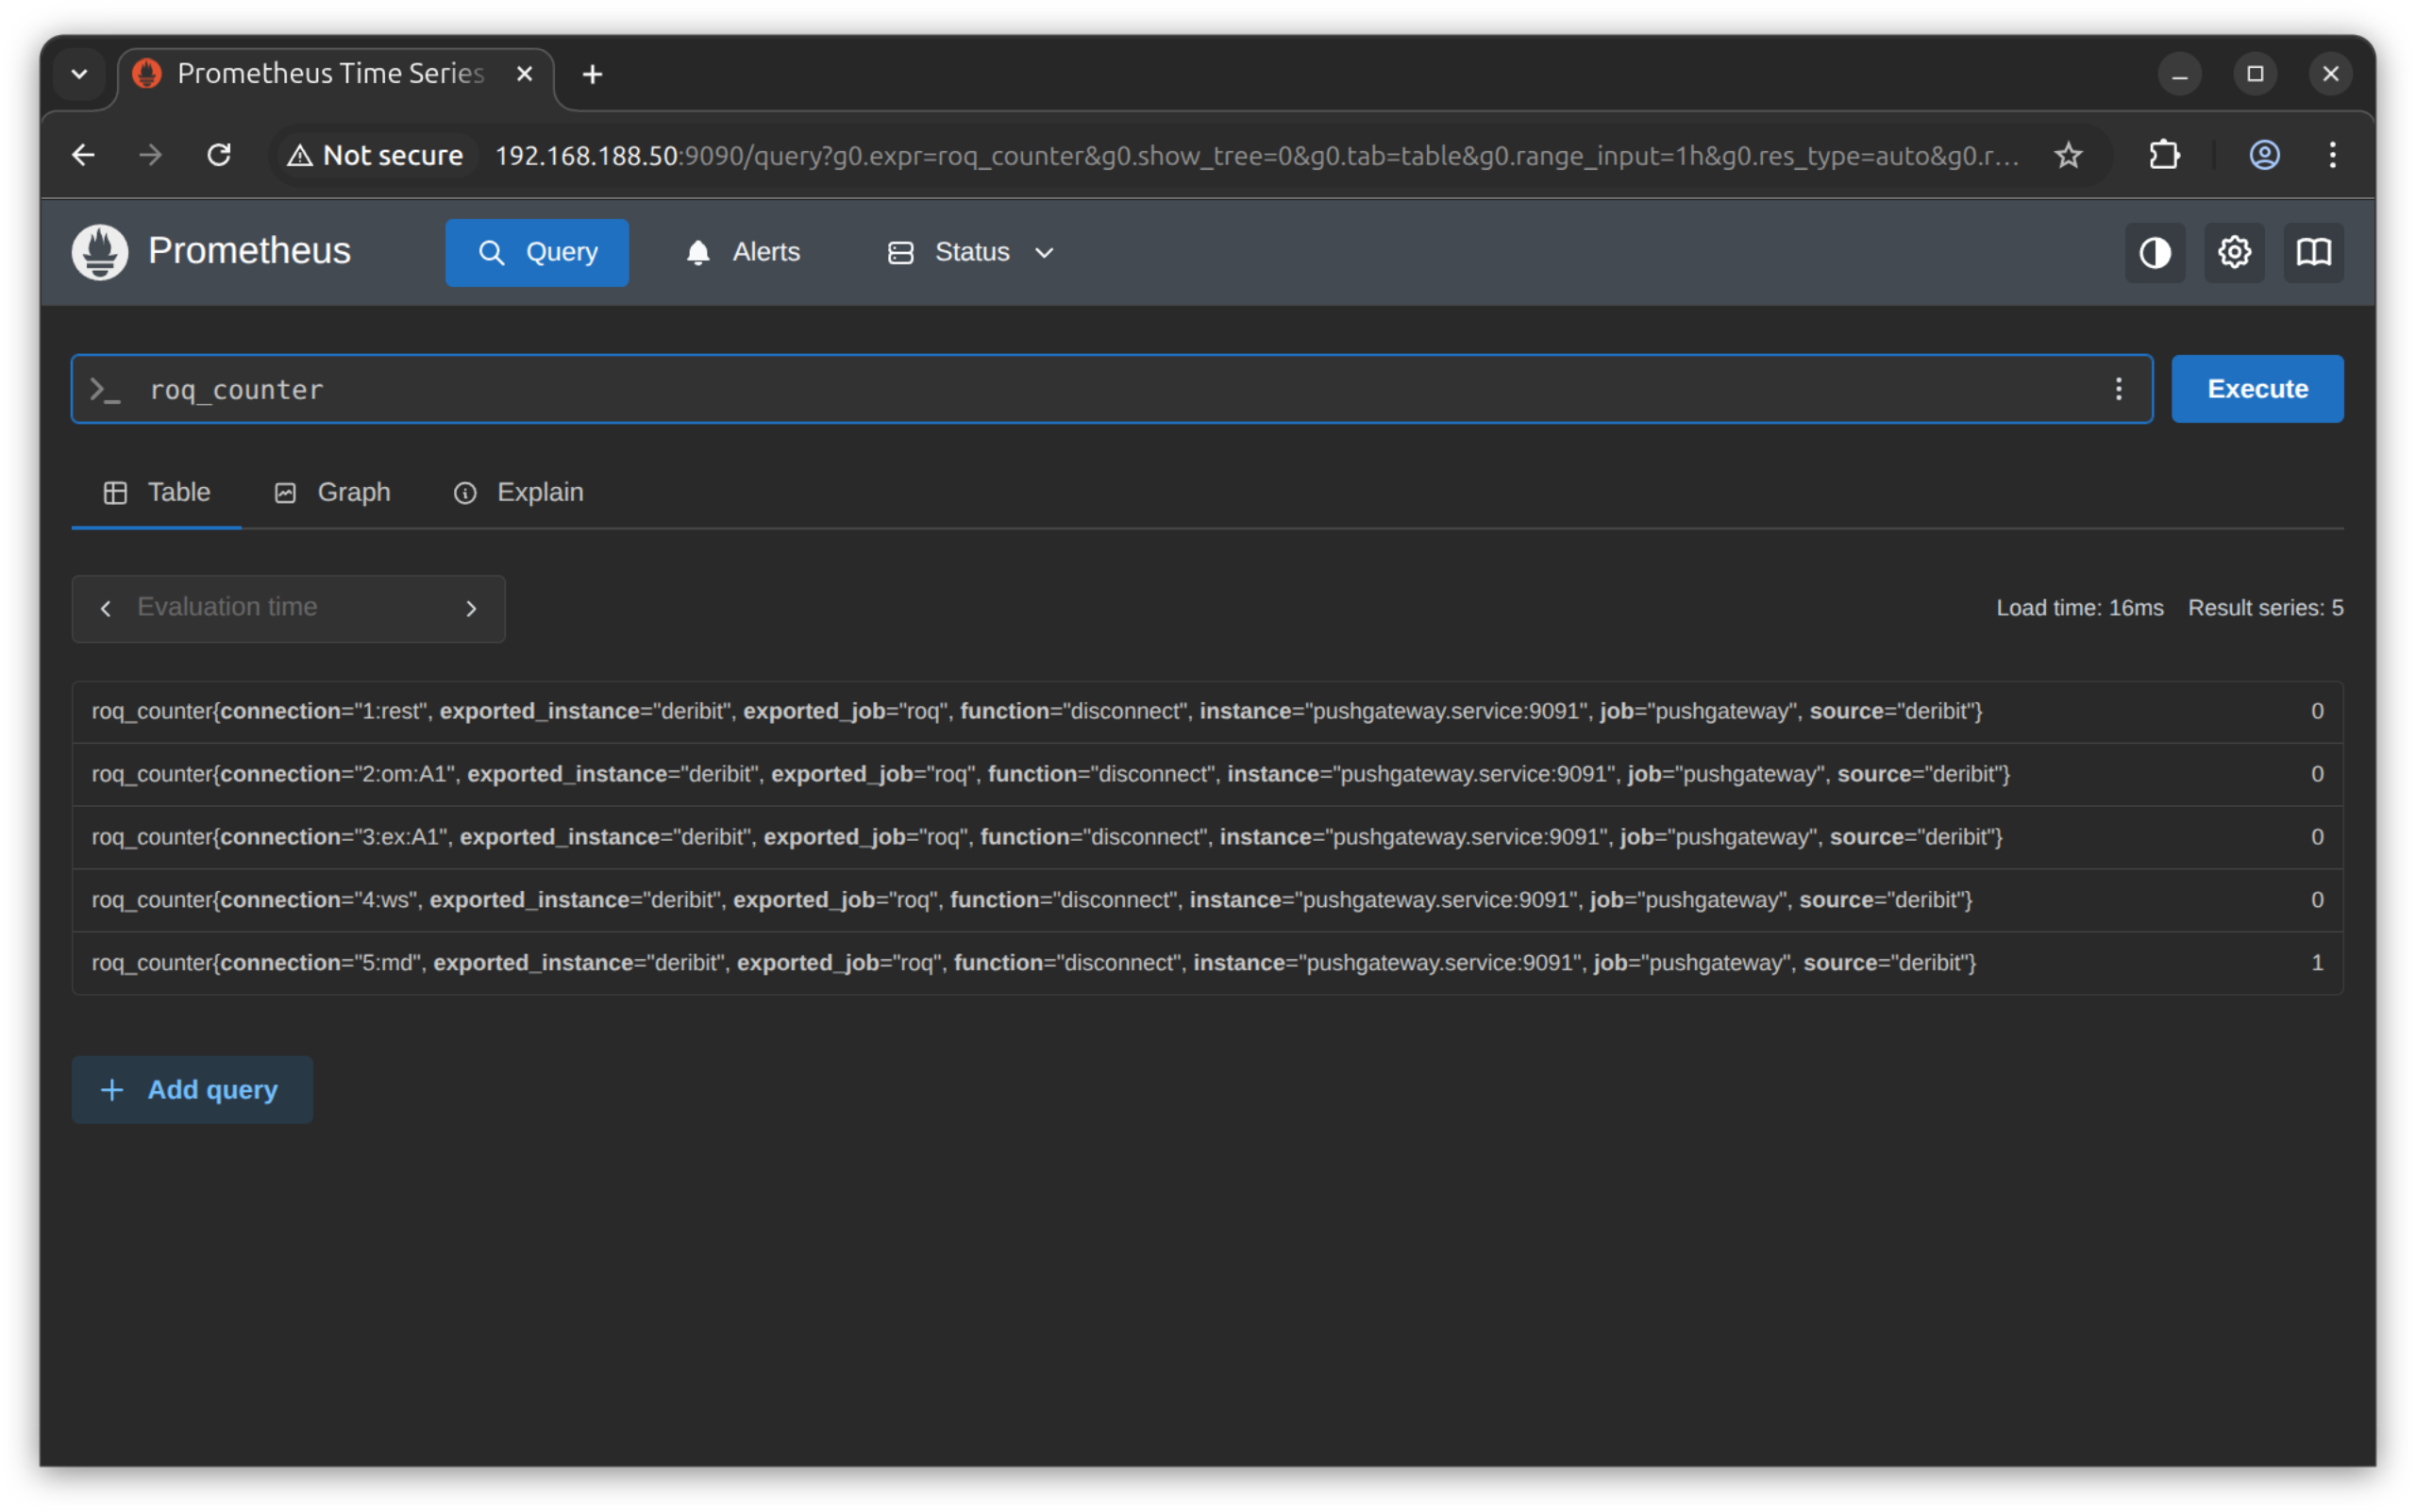
We will find the same metrics discussed in the previous blog post.
First, the connection counters
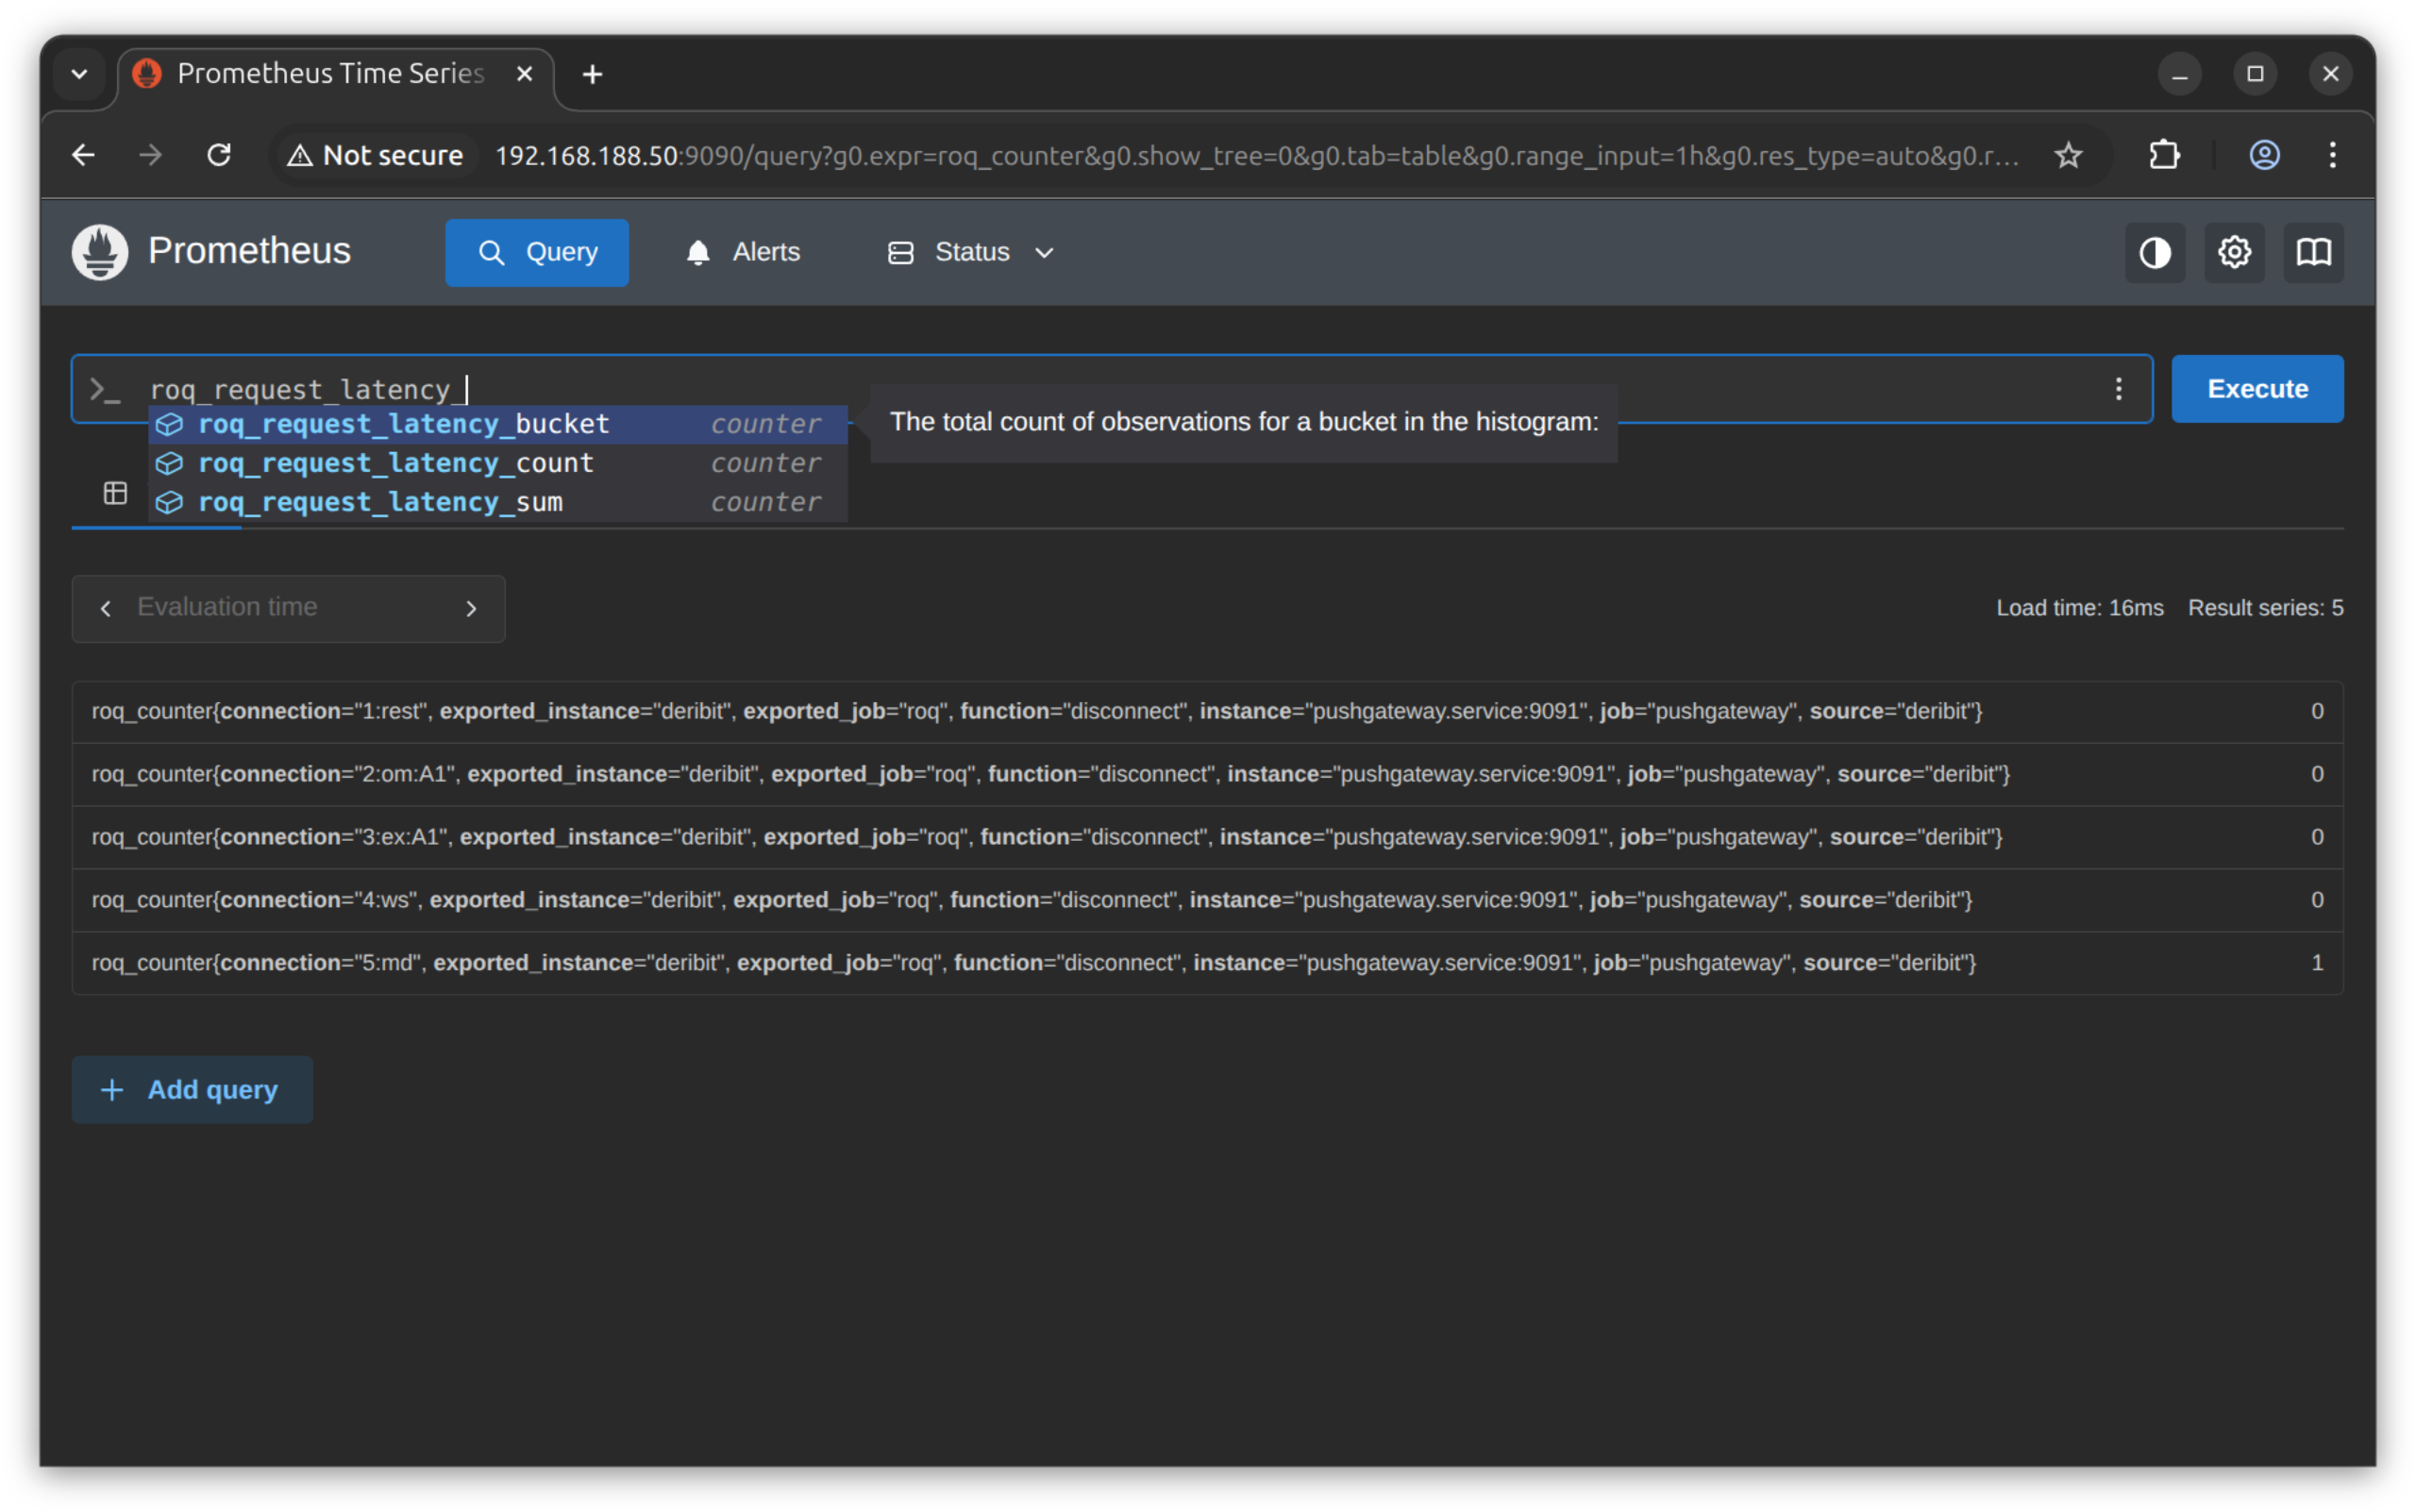
Second, the request latency
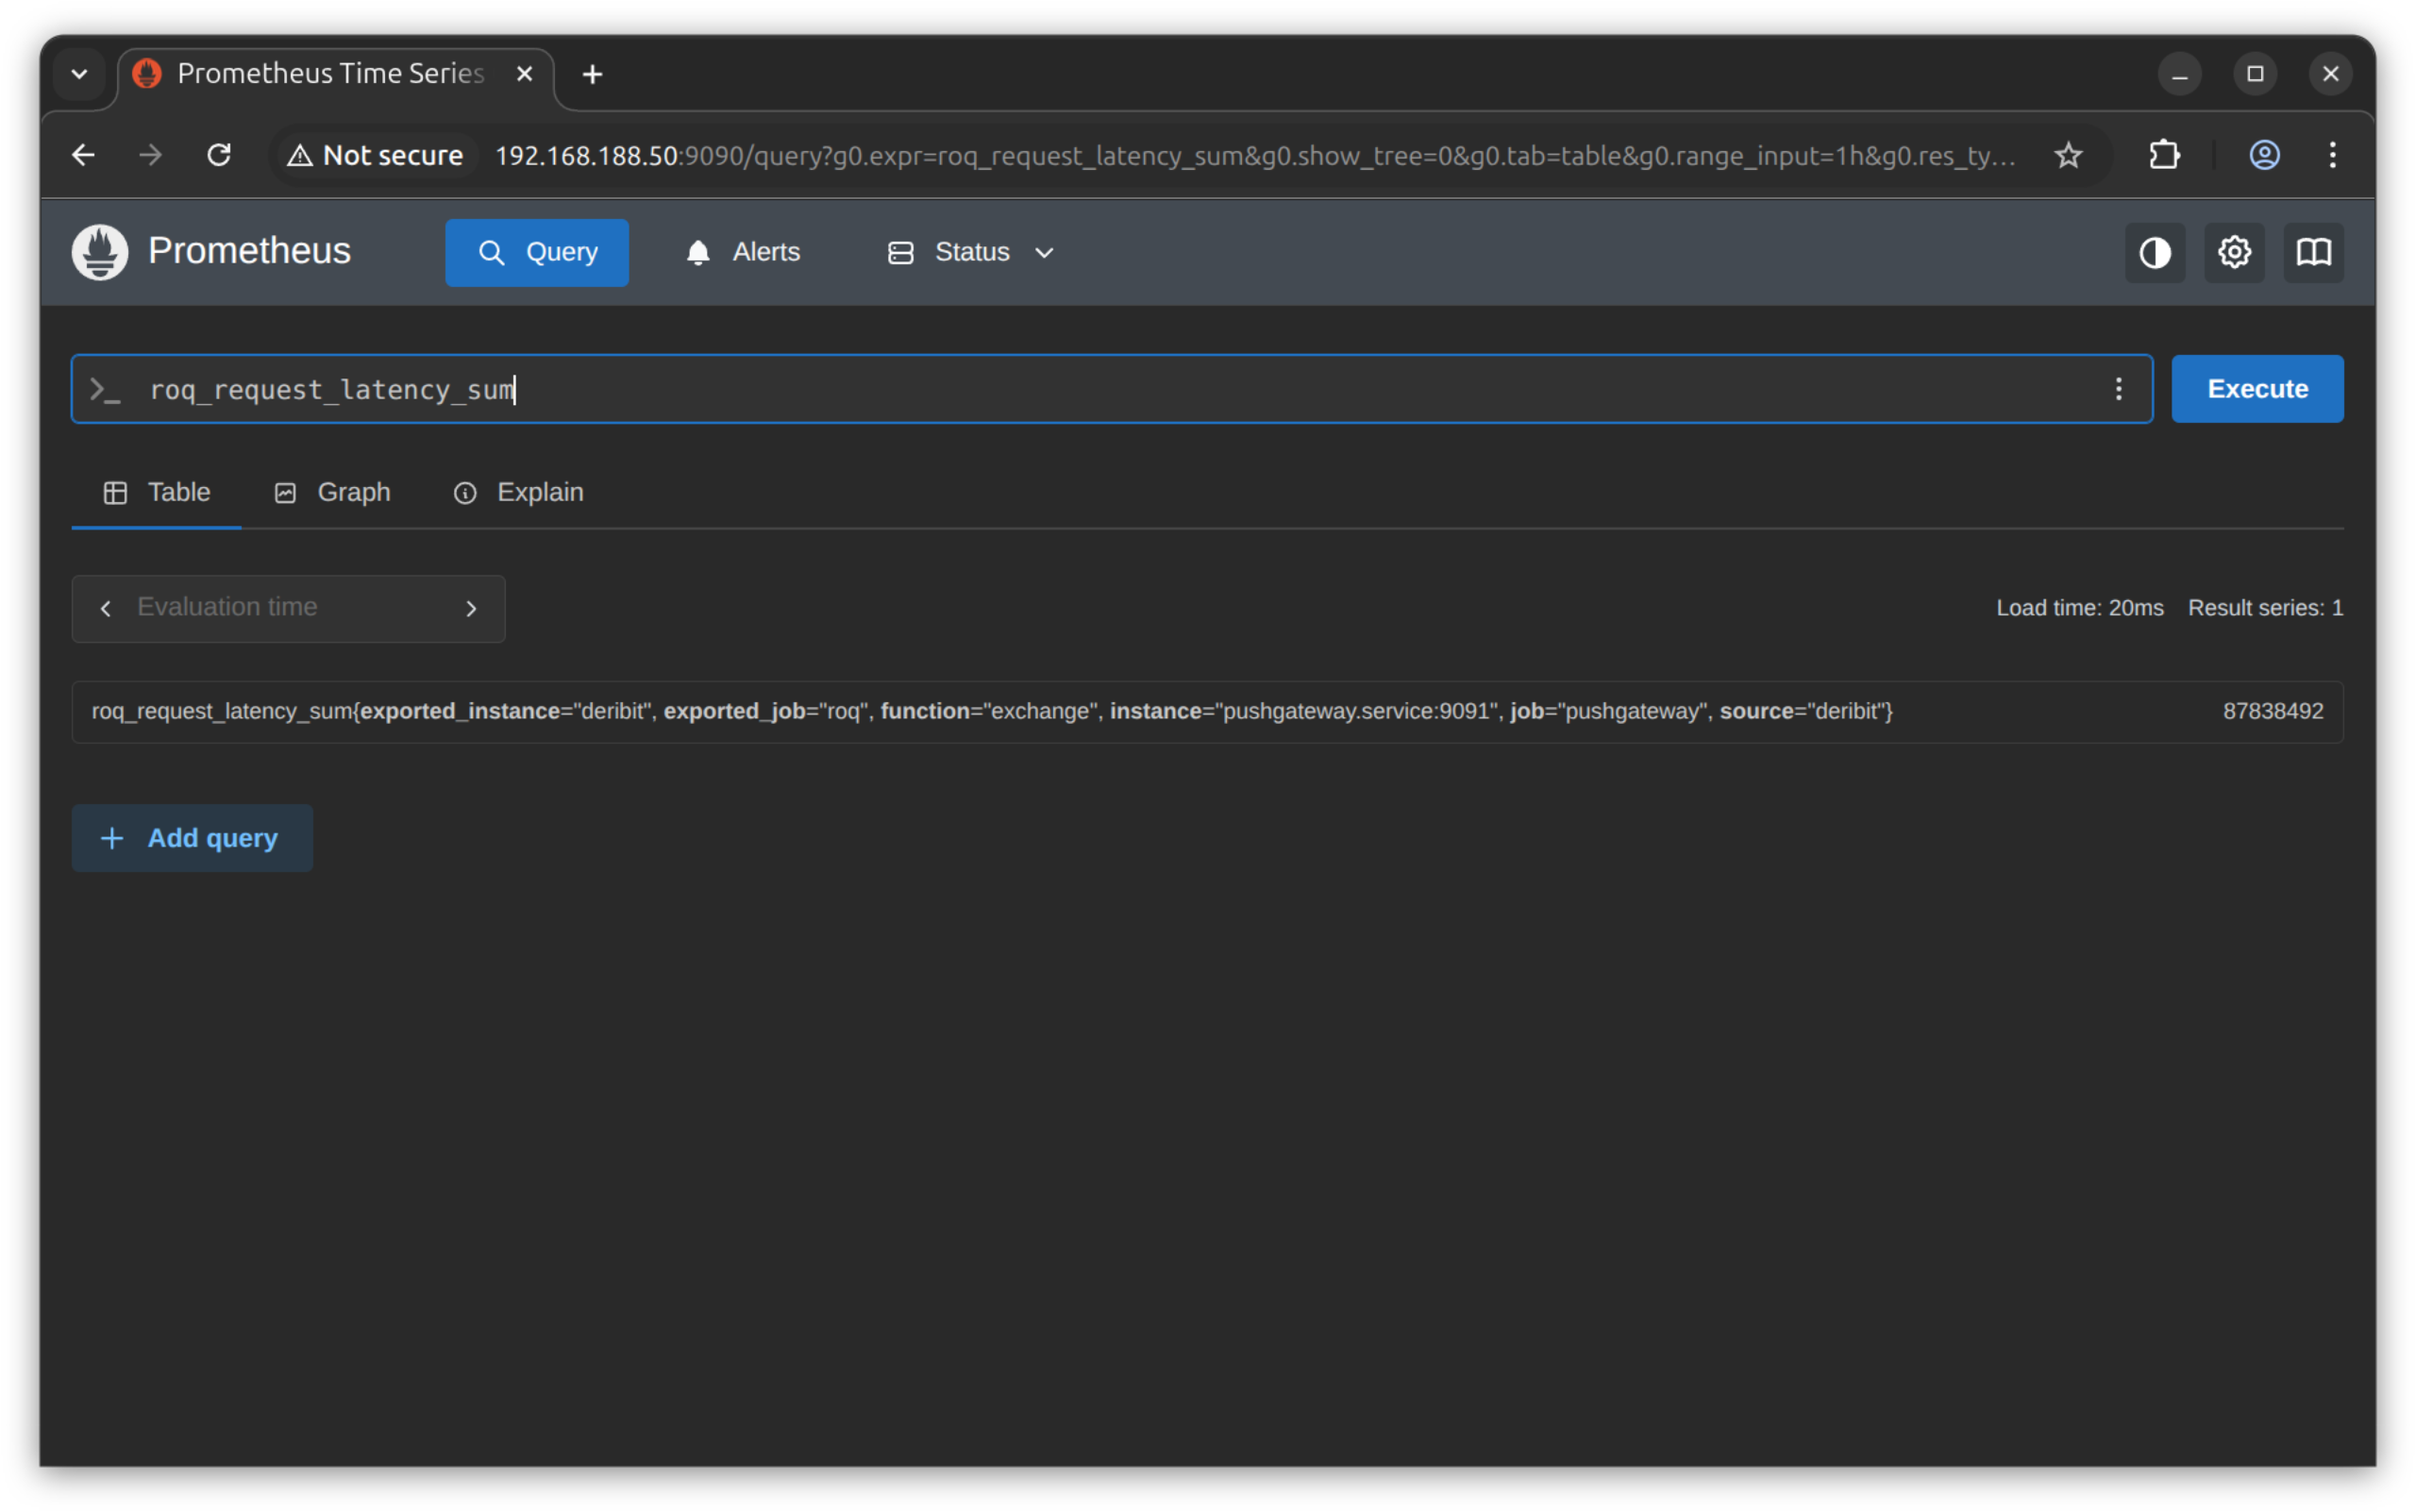
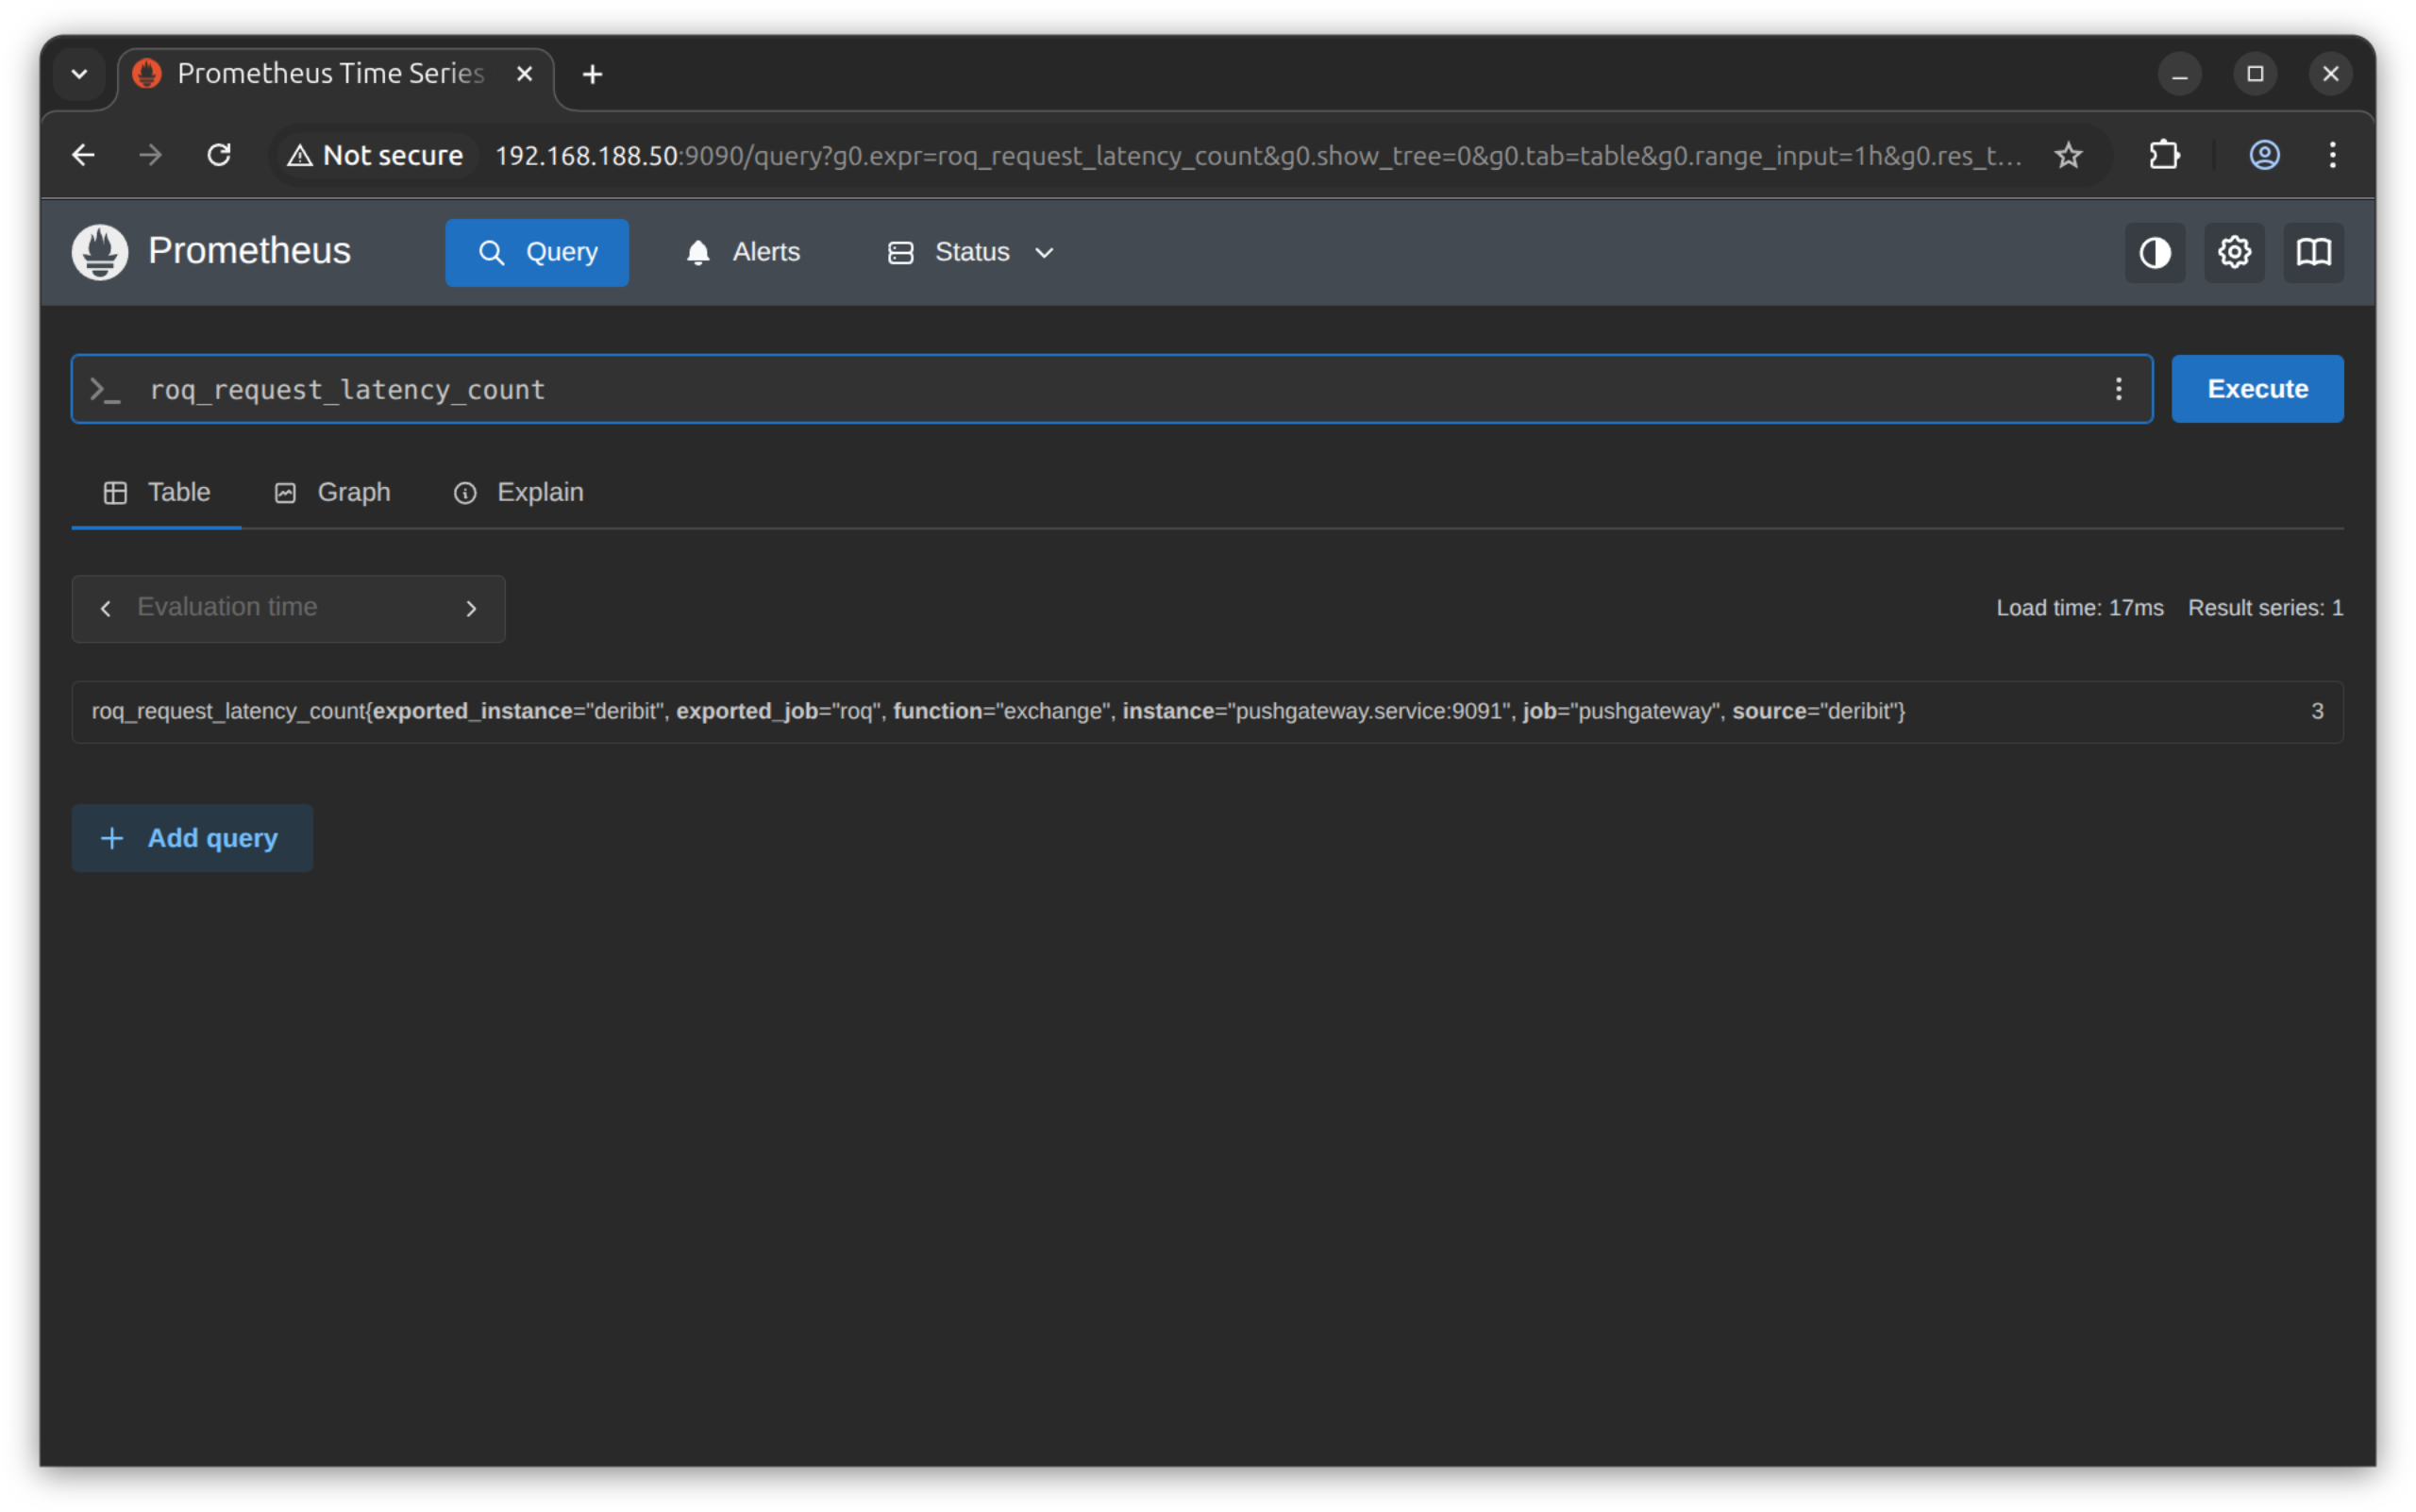
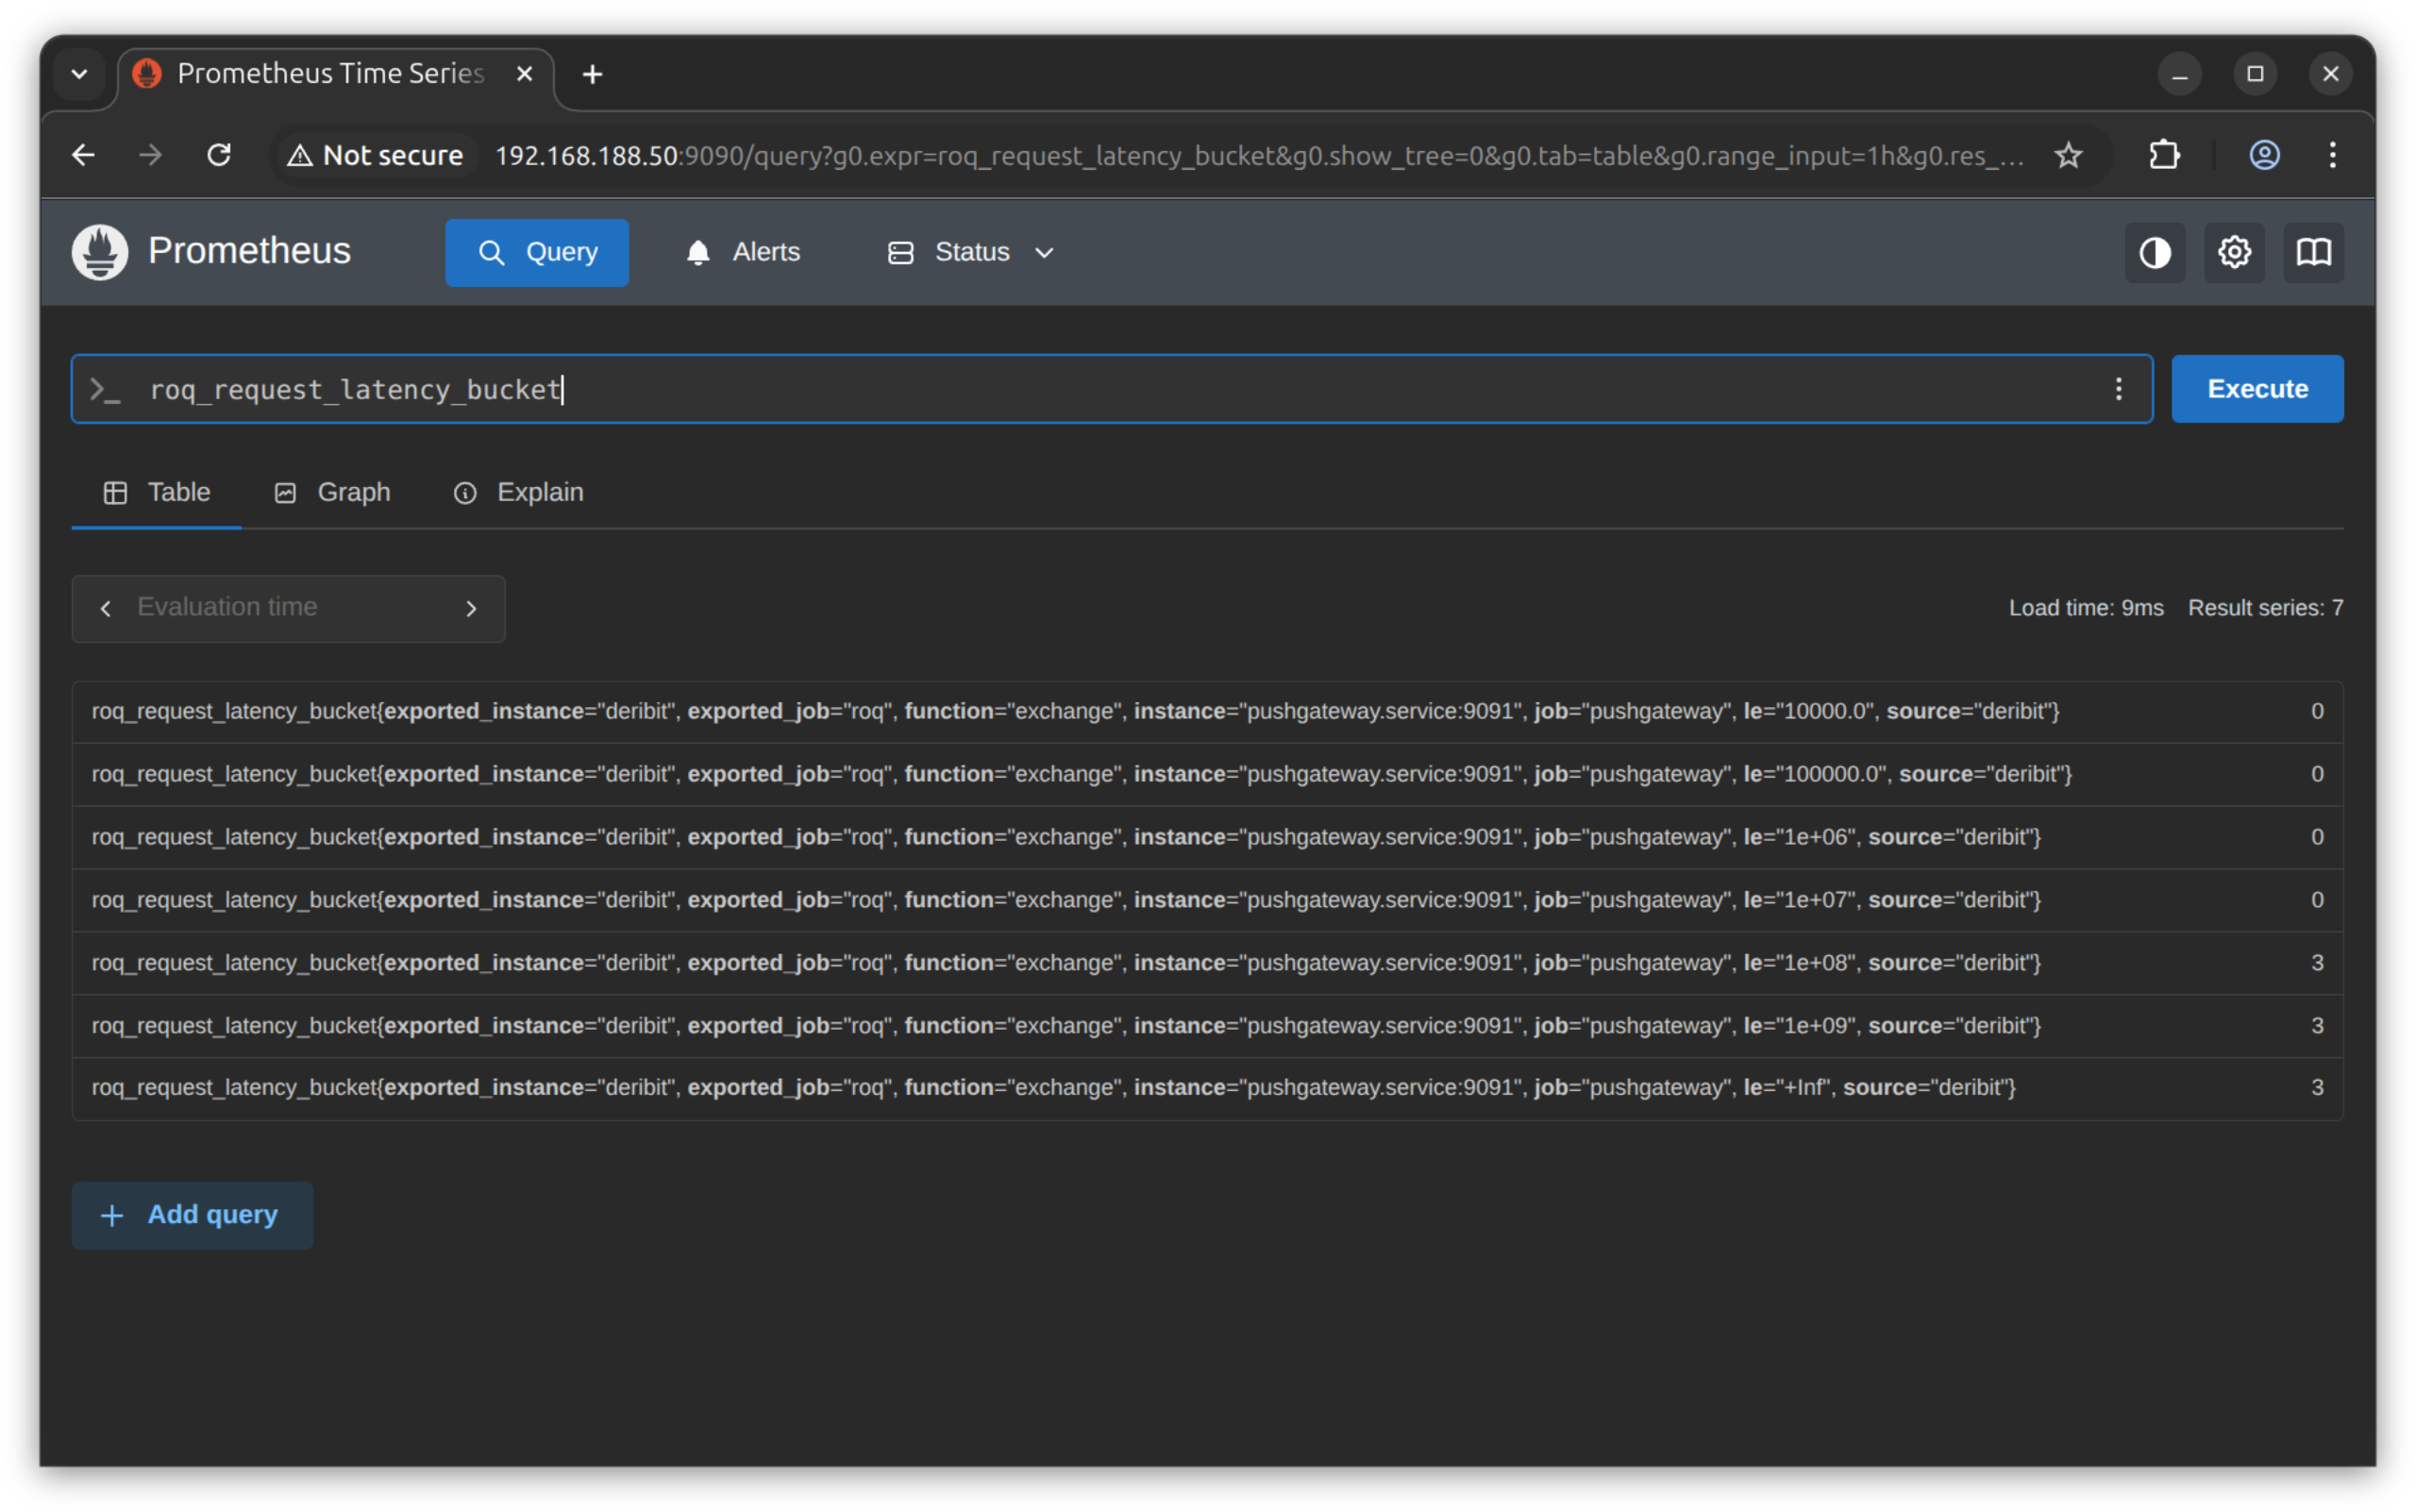
PromQL
Prometheus has a powerful query language.
Here we will demonstrate how to compute a time-series of exchange ping latencies (the roq_latency_* keys).
The most recent observation
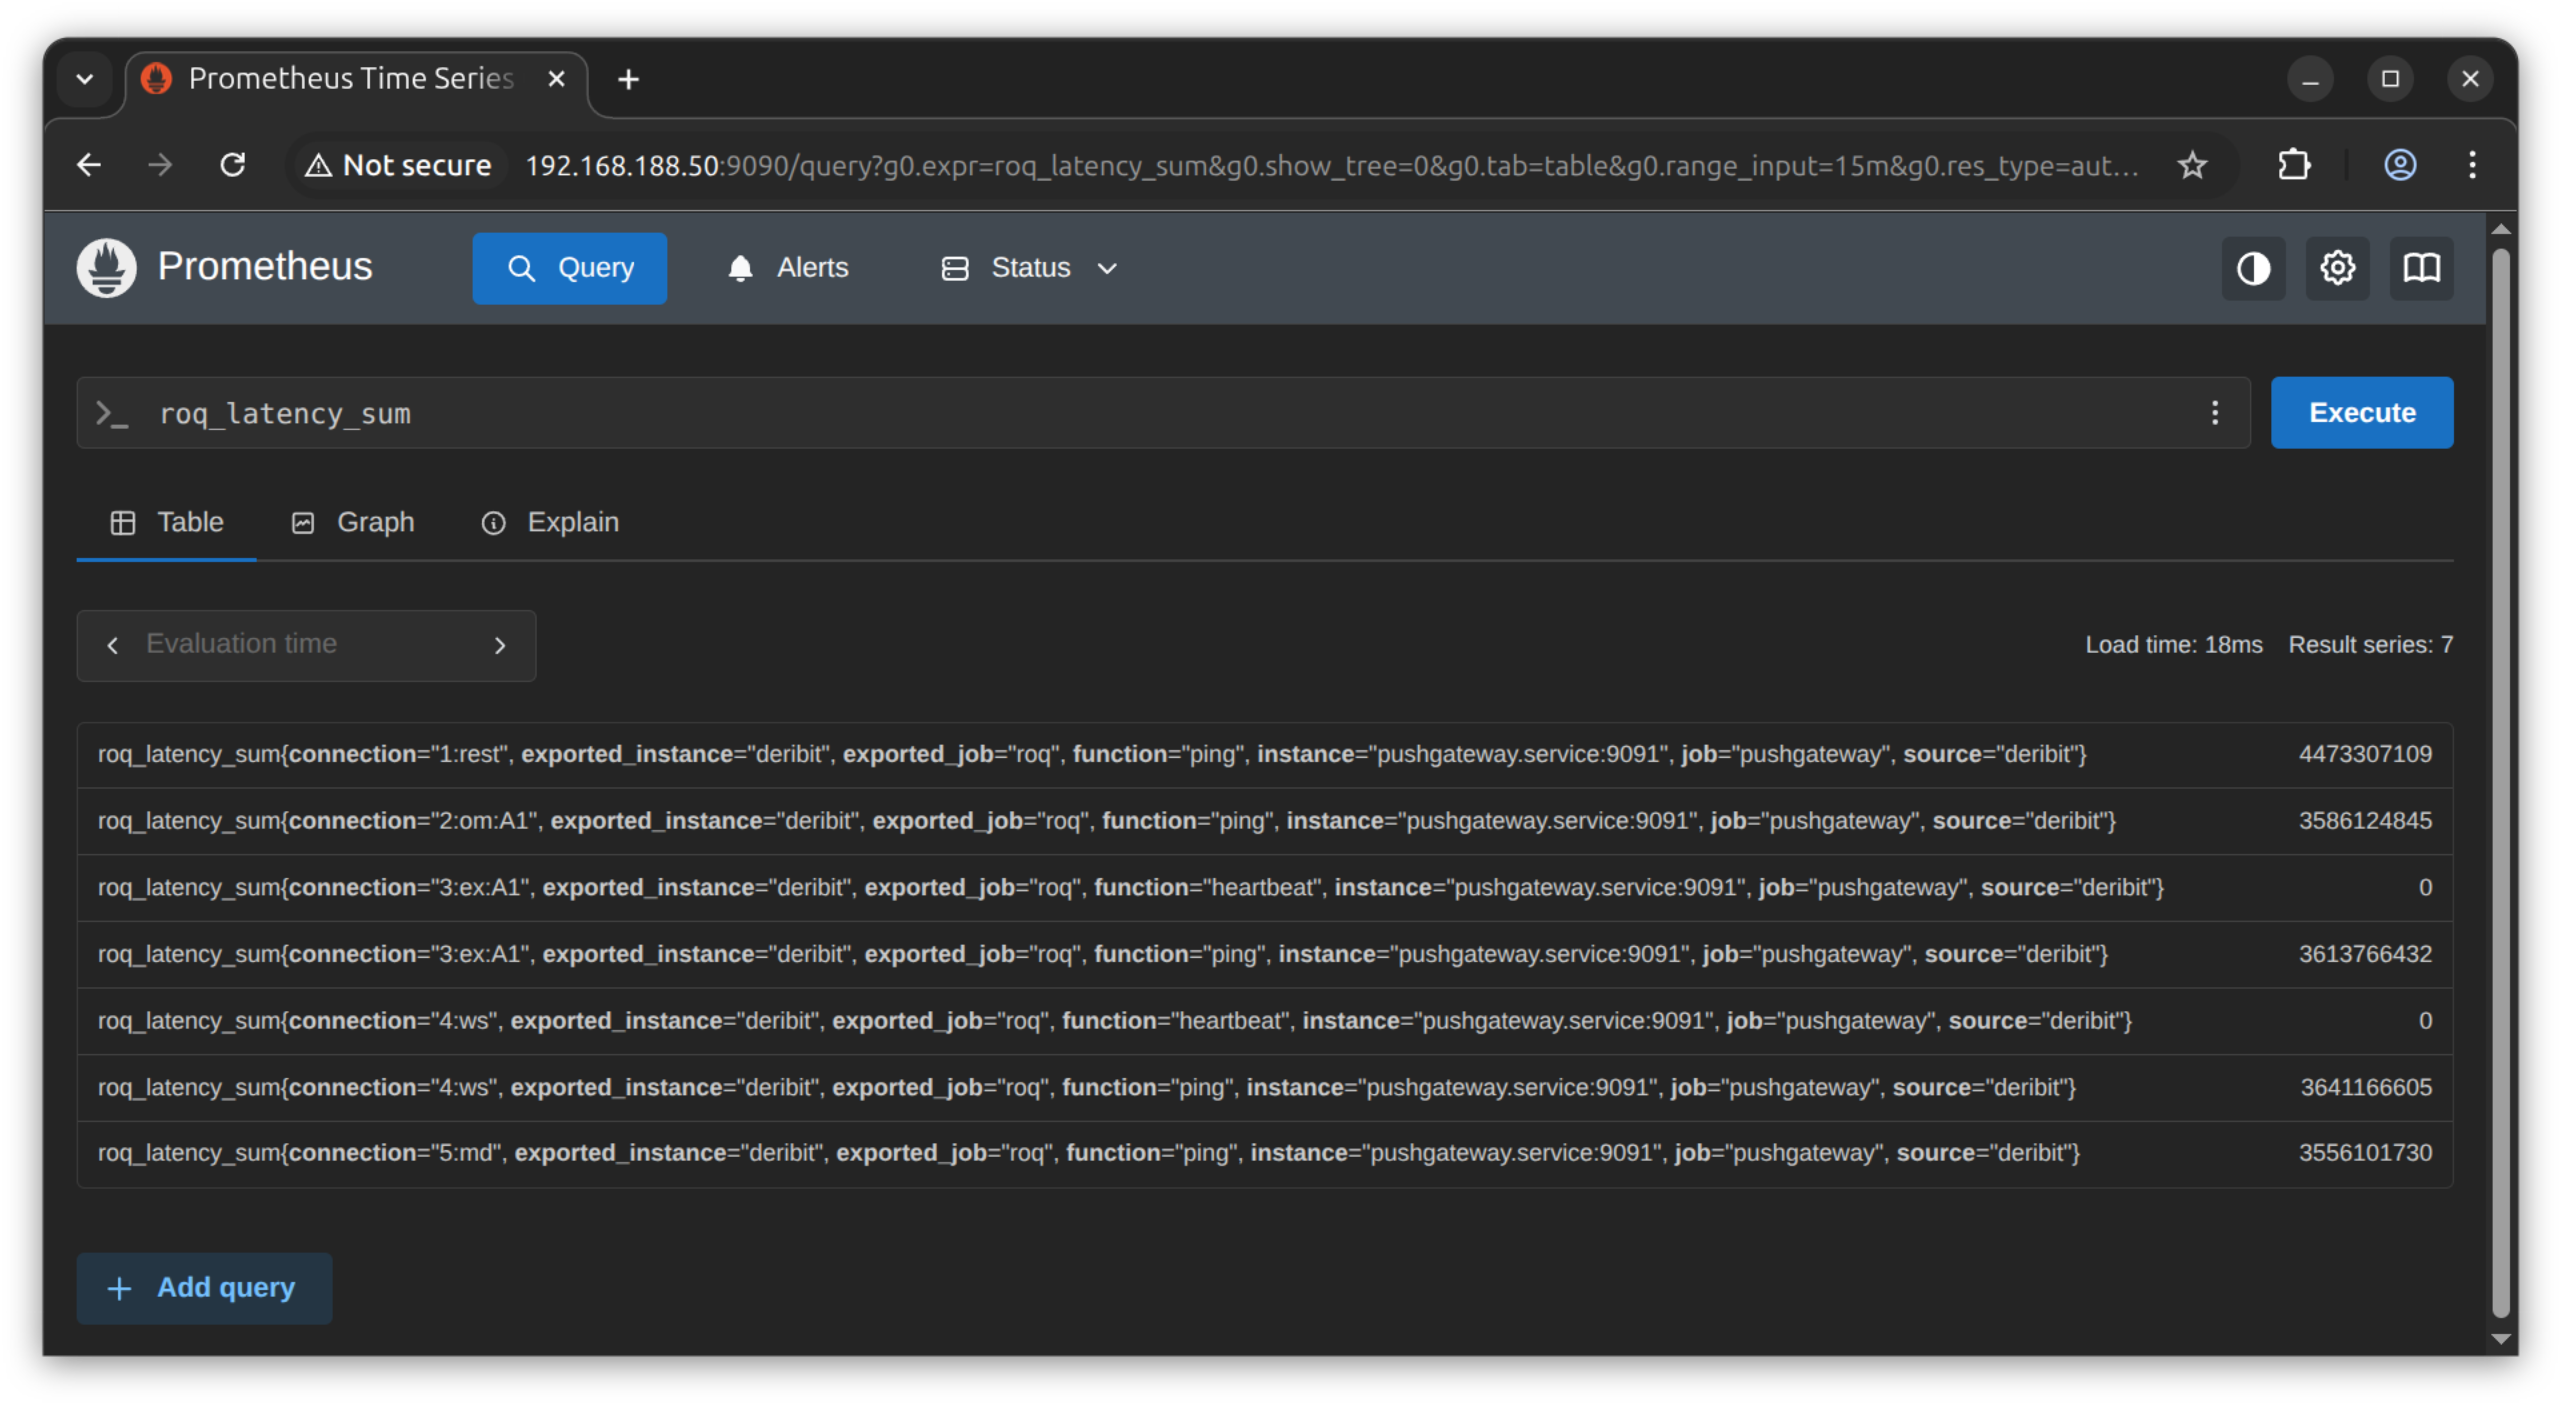
Here we repeat the last record
roq_latency_sum {
  connection="5:md",
  exported_instance="deribit",
  exported_job="roq",
  function="ping",
  instance="pushgateway.service:9091",
  job="pushgateway",
  source="deribit"
}
The labels generated by the gateway for this metric are
connectionfunctionsource
This is our query and the resulting time-series
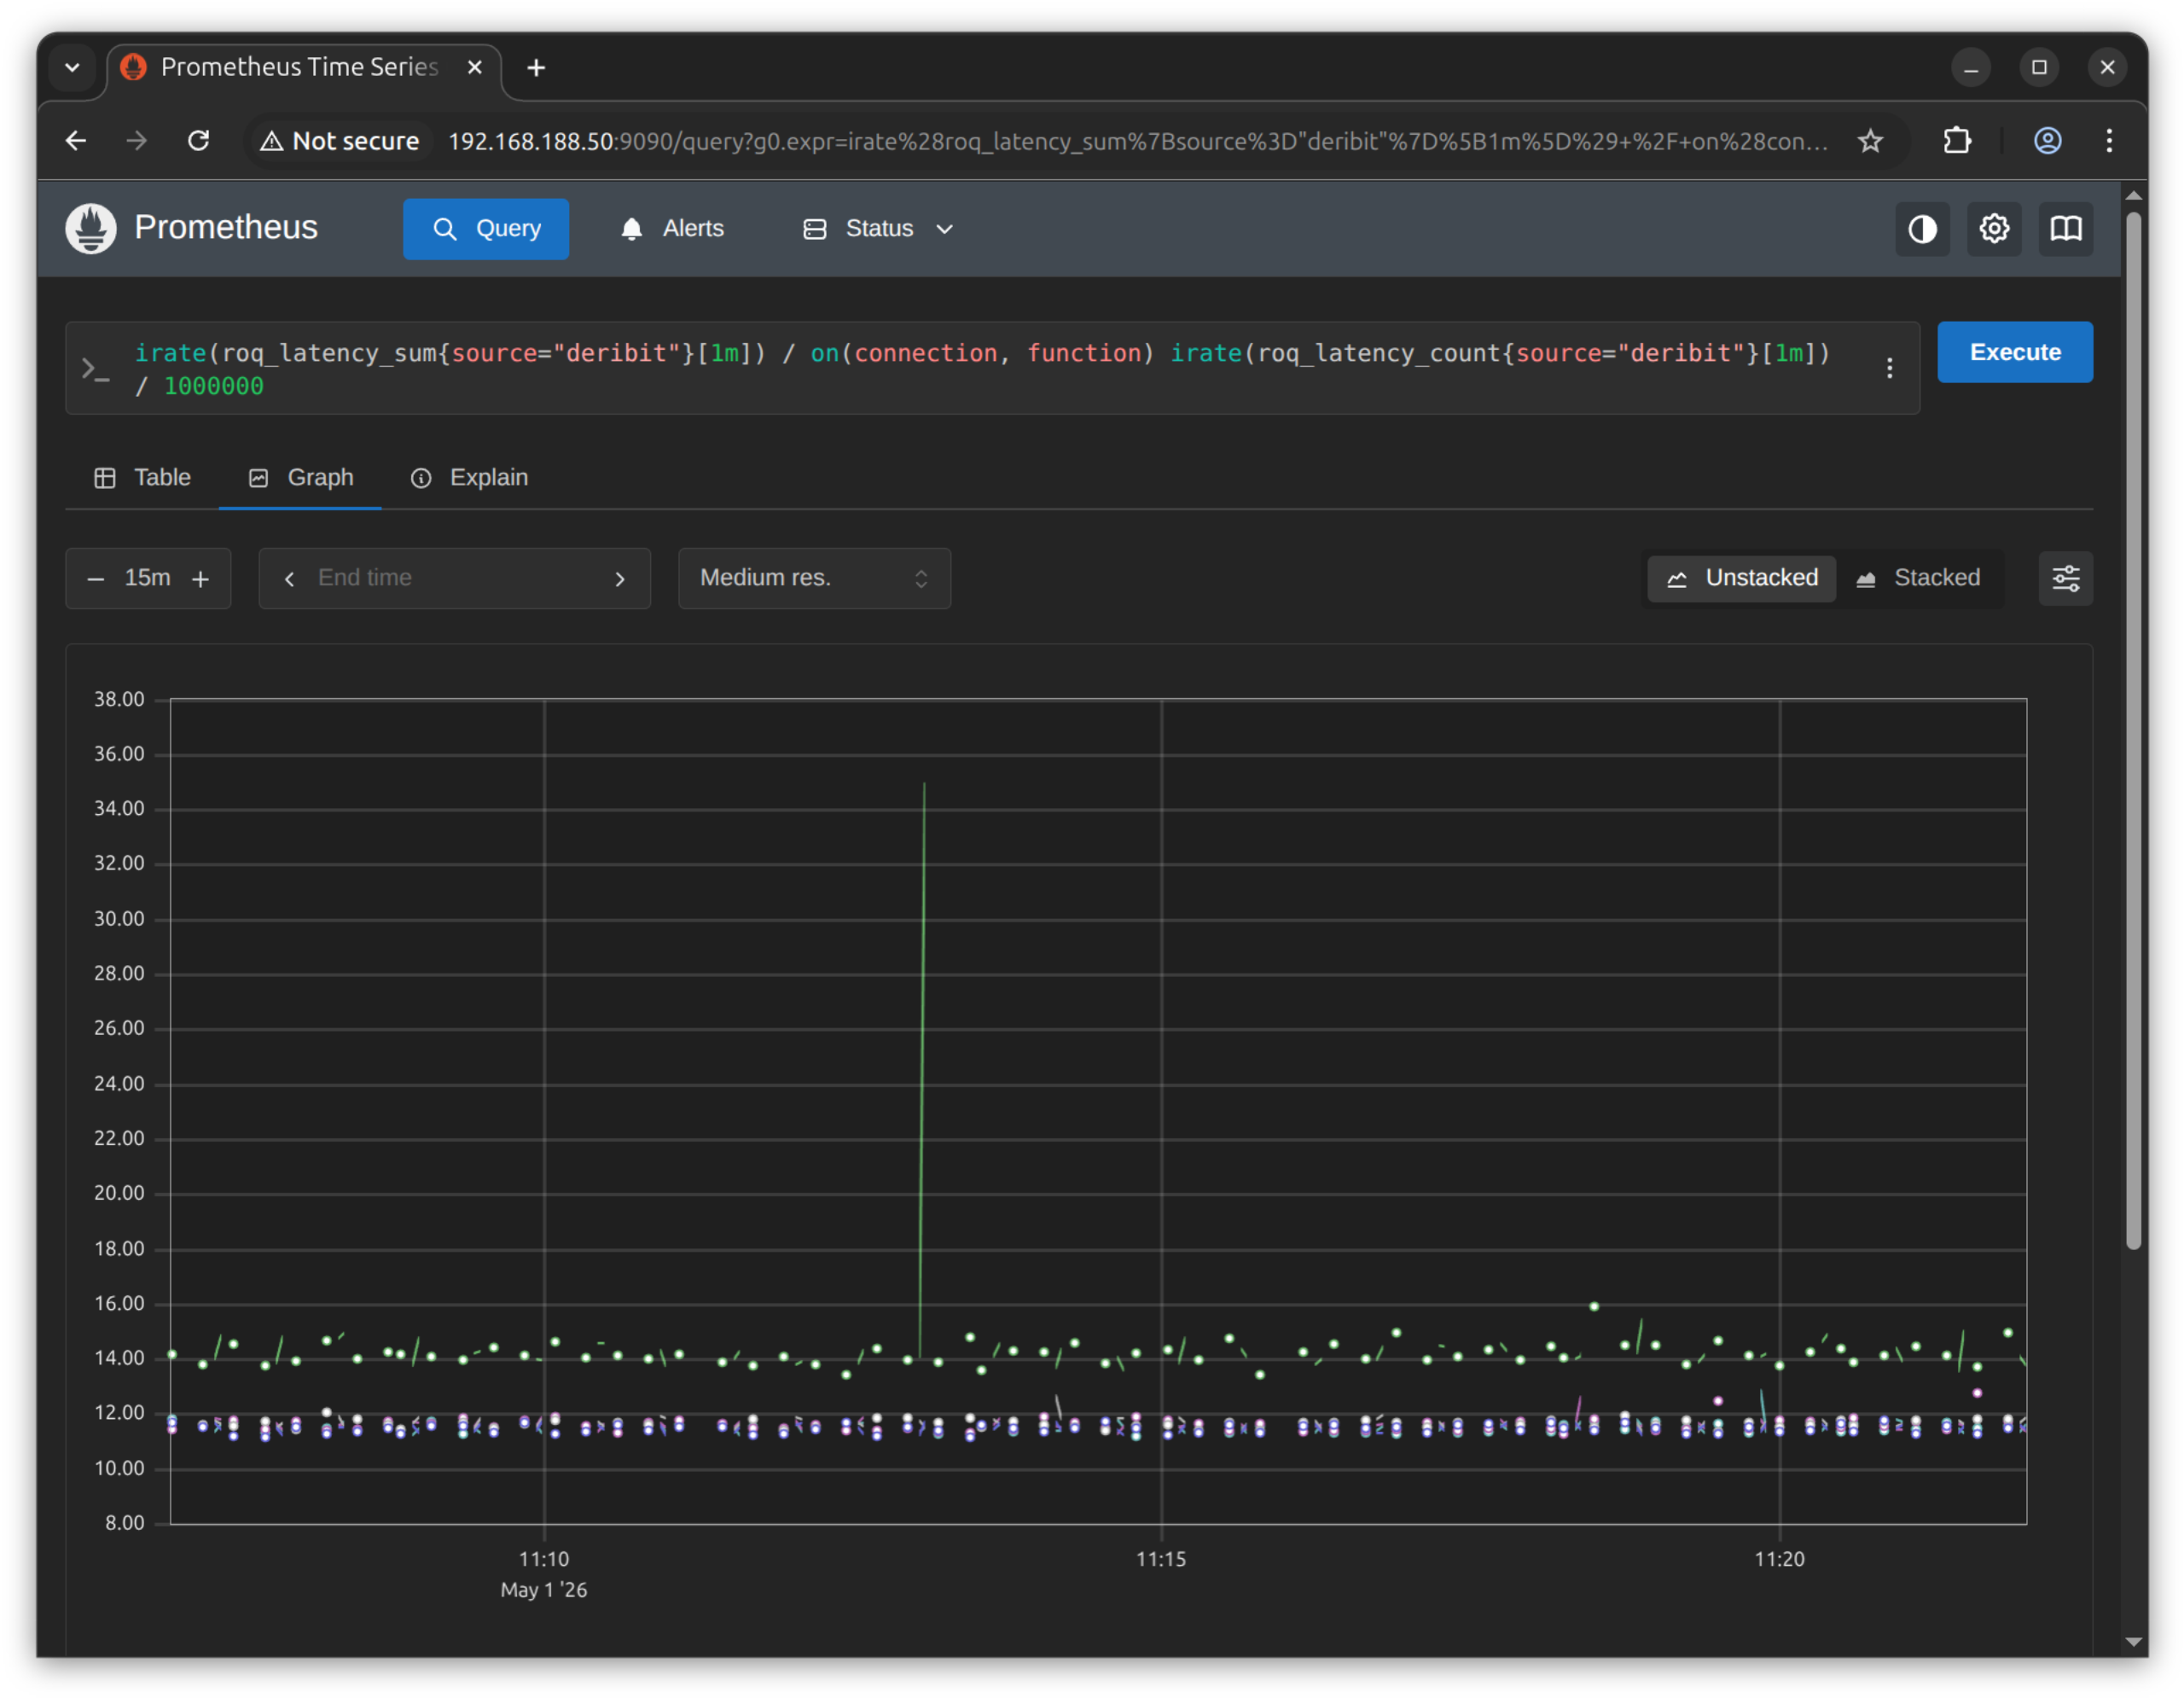
This is the query if you want to copy-paste
irate(roq_latency_sum{source="deribit"}[1m]) / on(connection, function)
irate(roq_latency_count{source="deribit"}[1m]) / 1000000